
Post Q1 Report Action
The technical response of the stock market to last week’s Tesla Q1 2016 report has been mostly negative. The stock lost quite a bit since last week, standing at around $208 when I write this, but overall 12-month Analyst Price Targets have actually increased with the average raising from $253 to $277, indicating that the Top Analysts did not see the report as negatively as this past week’s market action.
This is a small sample of the reactions from Top Analysts, noting that none of them changed their position to BUY, SELL or HOLD.
Adam Jonas of Morgan Stanley, reiterated a BUY with $333 price target, commenting that “we forecast ~70k units in 2016 (vs. the reiterated guidance of 80-90k shipments), which is composed of ~16k Model X and ~54k Model S units. In 2Q, we forecast ~17k deliveries–inline with the outlook.”
Charlie Anderson of Dougherty resumed coverage of TSLA with a BUY and price target of $500, noting that “the focus coming out of the Q1 report is on managements decision to pull-forward its production goal of 500K vehicles from 2020 to 2018. While this aggressive schedule certainly increases the risk of nearer-term stumbles, it also significantly pulls forward the earnings power. Tesla has set a goal to produce 1MM vehicles by 2020, roughly 2x what most observers previously believed. Our view is that demand is not the question; it is solving the manufacturing challenges deftly as they come.”
Brian Johnson of Barclays reiterated a SELL with $165 price target.
Ryan Brinkman of J.P. Morgan reiterated a SELL with $185 price target, as he “Doubts Tesla Motors Can Meet Accelerated Production Target.”
Colin Rusch or Oppenheimer reiterated a BUY with $385 price target, indicating that “we believe the critical characteristic of TSLAs business model over the next 24 months will be operating leverage. We believe the company can achieve 15%+ incremental operating margins as it ramps the Model 3. We modeling TSLA reaching 500k vehicles in 2019 vs. the target of 2018, noting the company has a history of setting nearly unachievable goals. Effectively we are accelerating ramp by a year from our previous expectations, but calculate that if the company reaches its 500k vehicle target in 2018 and 1M in 2020, our EPS estimates will prove ~30% too low.”
See the table below from TipRanks (tipranks.com) for a complete summary of the current top analyst ratings.
![TSLA analyst coverage [Source: TipRanks]](http://www.teslarati.com/wp-content/uploads/2016/05/TipRanks-1.png "TSLA analyst coverage [Source: TipRanks]")
TSLA analyst coverage [Source: TipRanks]
Swing Trading TSLA using the MACD
This is the first post where I will start outlining techniques that traders may want to use when trading TSLA stock.
I am mostly a “swing trader”. Swing Trading is a short term trading method that can be used when trading stocks and options. Whereas Day Trading positions last less than one day, Swing Trading positions typically last two to six days, but may last as long as two weeks (for TSLA sometime six-seven weeks). Swing traders use technical analysis to look for stocks with short-term price momentum. These traders aren’t interested in the fundamental or intrinsic value of stocks, but rather in their price trends and patterns.
There are a number of technical indicators that swing traders use. Today I will cover the MACD. The Moving Average Convergence Divergence (MACD) is a trend-following momentum indicator that shows the relationship between two moving averages of prices. The MACD is calculated by subtracting the 26-day exponential moving average (EMA) from the 12-day EMA. The Exponential Moving Average (EMA) is a type of moving average that is similar to a simple moving average, except that more weight is given to the latest data.
The good thing is that you really do not have to calculate any of these indicators yourself, as pretty much all trading platforms that I know of provide you with such indicators as an option when displaying the stock chart of a given security.
The following stock chart from Wall Street I/O shows the TSLA market data as “candlestick” (showing open, close, high and low of the day) for the past year, plus it also shows the MACD for the same period.
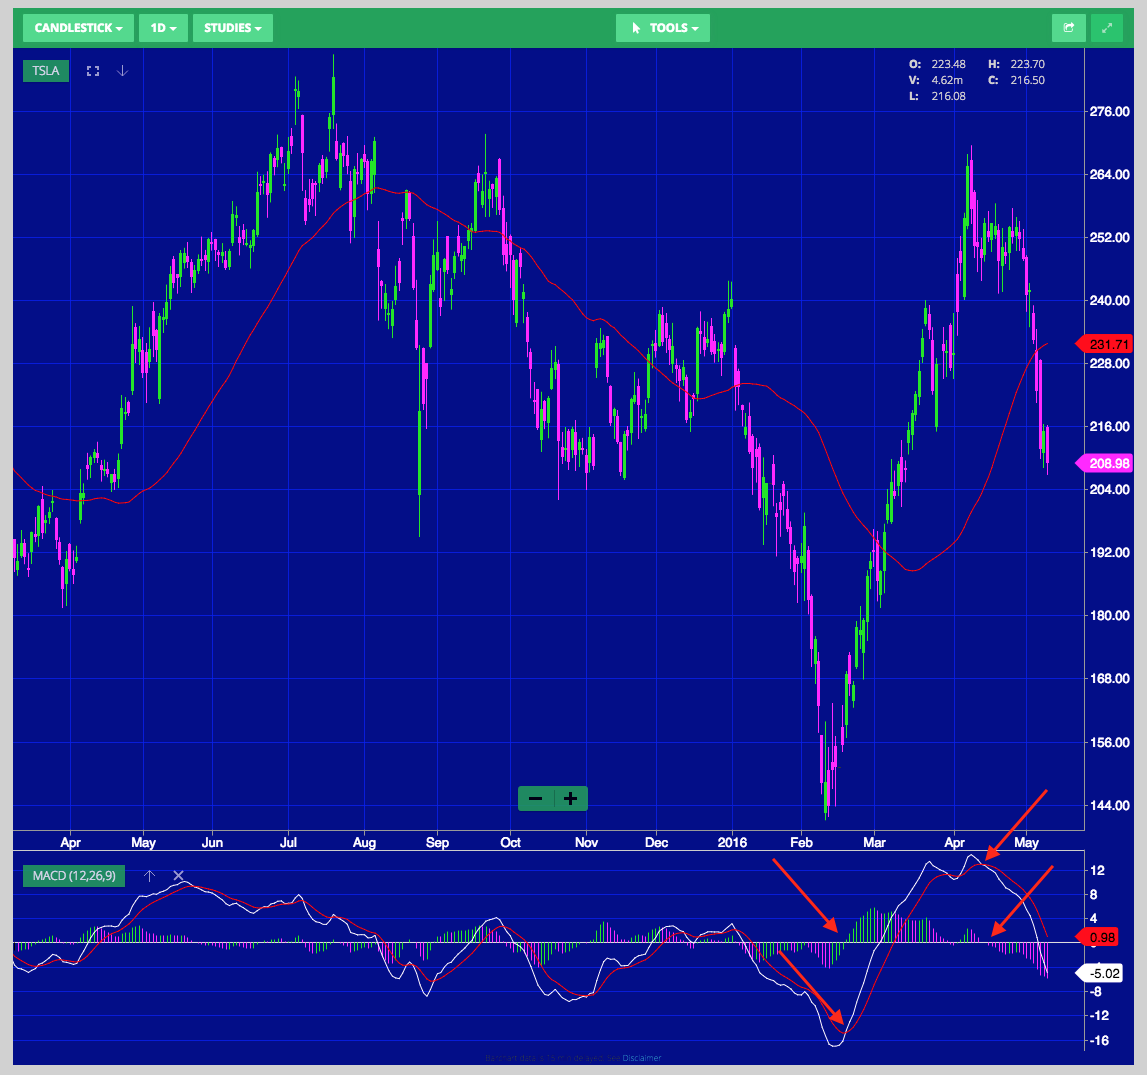
Source: Wall Street I/O
One technique that swing traders use is to enter a “long” trade when the MACD “crosses to the bulls”, and exit the trade when the MACD “crosses to the bears”. I have indicated these points in the chart for the huge run up between the February low and April high.
Micah Lamar is the CEO of Wall Street I/O (wallst.io), where together with his team of experts he helps people learn stock and option trading. Disclosure: I have been a subscriber to wallst.io for a few years.
This past weekend, Micah run a “MACD Validation” experiment on TSLA 1-year behavior up to last Friday close. The results are as follows.
Micah found that “if one had bought TSLA stock exactly a year ago, and held it for the full year, one would have incurred a $30 loss per share.
If one had bought and held TSLA stock while the MACD was bullish, one would be up $22 for the year.
If one had sold (short) TSLA stock while the MACD was bearish, one would be up $51 for the year.”
Someone trading both sides (long and short the stock) would be up a whopping $73, or a $30% gain.
Of course, trading the same entry and exit points based on the MACD with put or call options instead of stock would have resulted in returns 10 to 100 times or better than if just trading TSLA stock.
Micah indicates that “TSLA is a great stock for swing traders: the reason is that it has so much “beta.” A high beta indicates that a security is much more “volatile” than the rest of the market. Most high-tech stocks like TSLA have a beta of greater than 1, offering the possibility of a higher rate of return, but also posing more risk.
As far as where TSLA is today, it is still in “bearish” territory (as far as the MACD and other indicators are concerned), which for me it means that it is untouchable on long trades as “too risky”, and since I do not like to play on the downside for stocks of companies that are in my “buy what you know” list, I will not trade it again until the MACD crosses back to the bulls.