News
SolarCity poised for rapid growth as residential solar installations soar
The recent merger of Tesla and SolarCity introduces a new era in residential solar energy generation. With the demand for solar energy in the U.S. rising each year, benefits to both our environment and the nation’s economy increase. The trend toward residential solar installations does require efficient planning and execution of public policies. It also calls for analysis of the status of residential solar in order to move toward an enhanced solar integration across the U.S.
What does residential solar look like today in the U.S.?
Residential solar today is primarily a coastal phenomenon, although more than half of the states have enough residential solar to power at least a few thousand homes. Yet, in the third quarter of 2016, the U.S. surpassed all previous quarterly solar photovoltaic (PV) installation records: 4,143 megawatts (MW), or a rate of one megawatt (MW) every 32 minutes. That pace is even faster today, as the fourth quarter will surpass this past quarter’s historic total, according to the Solar Energies Industry Association (SEIA).
“The solar market now enjoys an economically-winning hand that pays off both financially and environmentally, and American taxpayers have noticed,” Tom Kimbis, SEIA’s interim president, said of the recent rise in residential solar. “With a 90 percent favorability rating and 209,000 plus jobs, the U.S. solar industry has proven that when you combine smart policies with smart 21st century technology, consumers and businesses both benefit.”
Here are the top five U.S. states with residential solar rooftops in September, 2016:
- California: 3,258 MW
- Arizona: 539 MW
- New York: 444 MW
- New Jersey: 386 MW
- Massachusetts: 361 MW
These levels are considered ample to power a significant number of homes in their regions.
What’s the potential for other states to increase residential solar in the near future?
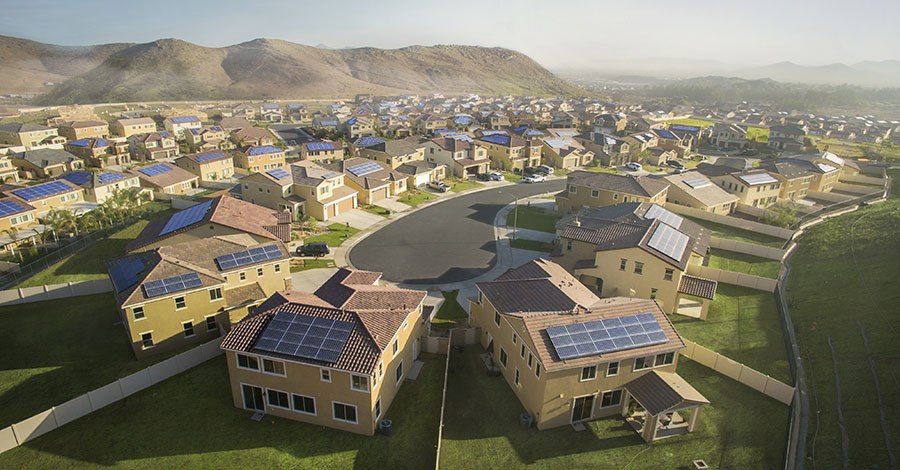
In order to power more than a few thousand homes and to become a major energy source across America, solar saturation must become deeper across existing states and more widespread among states that currently provide limited residential solar. Rooftops provide a large expanse of untapped area for solar energy generation, according to the National Renewable Energy Laboratory (NREL). What’s needed to reduce costs and losses often associated with transmission and distribution of electricity? Onsite distributed generation, such as that which is available from SolarCity and others. Yet, to create a paradigm in which onsite distributed generation can become a reality, different and sometimes dissonant potentials must be addressed.
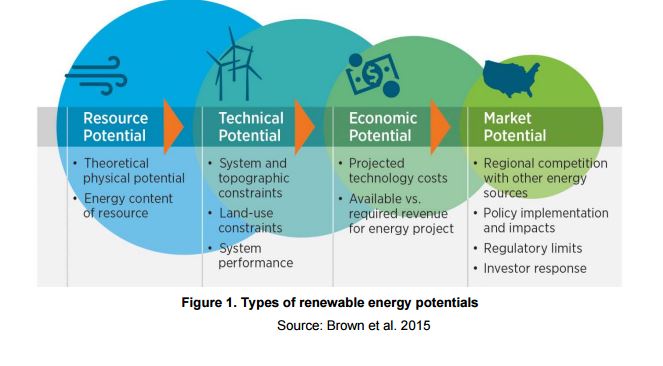 Technical potential considers multiple factors in a given region, such as resource availability and quality, technical system performance, and the physical availability of a suitable area for development. In other words, it measures how much of the total resource can actually be captured. It is often the only area of focus when residential solar is discussed.
However, in order for solar to reduce pollution, help homeowners to lower utility bills and gain more energy independence, technical aspects of the larger solar equation must work in sync with resource, economic and market potential.
- Resource potential is the entire amount of energy in a particular form for the region;
- Economic potential is possible generation quantity that results as a positive return on the
investment of constructing the systems; and, - Market potential estimates the quantity of energy expected to be generated from the deployment of a technology into the market. It considers factors such as policies, competition with other technologies, and rate of adoption.
A study from the NREL indicates that, taking into account these four types of potential, there are broad regional trends in both the suitability and electric-generation possibilities of rooftops. Although only 26% of the total rooftop area on small buildings is suitable for PV deployment, the sheer number of buildings in this class gives small buildings the greatest technical potential.
What factors contribute to successful onsite distributed solar generation?
Small building rooftops could accommodate 731 GW of PV capacity and generate 926 TWh of PV energy annually, according to NREL, which represents approximately 65% of the total technical potential of rooftop PV. Think about how much energy could be generated by rooftop solar panels in each state if they were installed on all suitable roofs. Of course, the amount of suitable roof area, which takes into account factors such as shading, roof tilt, roof position, and roof size, must be included in any potential residential solar project planning.
 -
-
The folks at SolarCity truly believe that, in every state, home rooftop solar could be a major energy resource. With research data backing their conclusions, they feel that U.S. total home solar capacity could increase 100 times over, and each state could meet 10-45% of its electricity needs from residential solar alone.
Add in roofs of medium and large buildings, and the solar integration number rises to 40 percent of all the electric demand in the continental U.S. By comparison, all rooftop solar today combined provides less than 0.5 percent of the nation’s electricity.
The potential for home rooftop solar to become a major energy source is enormous — in every state. And SolarCity argues that, the sooner that homes across the country become a part of that future, the more years they’ll have to enjoy its benefits.
Sources: Solar Energy Industries Association, National Renewable Energy Laboratory, SolarCity

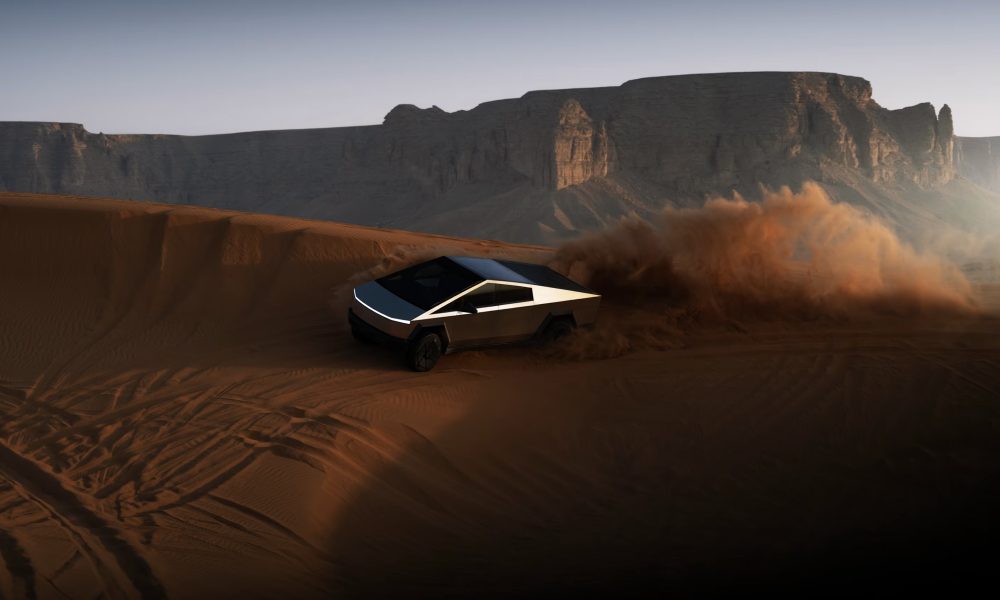
Tesla has continued to flex the strength, rigidity, and robustness of its all-electric pickup, the Cybertruck. In fact, since 2019, Cybertruck’s ability to avoid dents, dings, and even gunfire has been one of the main selling points Tesla has used to attract buyers who are looking for a vehicle that can handle the most intense challenges.
But that does not mean Tesla is not still actively trying to make it even better.
In a new hardware update, Tesla has decided to change the material of the Cybertruck’s underbody panels from aluminum to carbon fiber, a move that aims to not only increase pricing efficiency but also improve strength.
RELATED:
Cybertruck Lead Engineer Wes Morrill confirmed the change was made to the Cybertruck recently after it was spotted by Coleton Guerin of Out of Spec. This particular trim level was a Cyberbeast, but it is being applied to all trims to keep supply chain efficiency high and have less variance across trim levels.
Morrill said that Tesla tested different materials for the underbody panel protection, and carbon fiber performed better than aluminum, which is what the company was using since its first deliveries in 2023.
-
Additionally, there are some efficiency improvements because Tesla can better form the areas around the bolts to keep underbody airflow cleaner than previously.
good eye – it’s a new material. Testing showed it to be more durable than the aluminum while being lower weight and cost. Also slight efficiency improvement since we can better form the areas around the bolts to keep the underbody airflow cleaner than what stamped aluminum allows
— Wes (@wmorrill3) July 30, 2026
Carbon fiber is traditionally lighter and more durable than aluminum, which is why it is such a popular material among luxury automakers, and EV makers will utilize some of the materials around battery packs to save weight.
This is the first instance of Tesla utilizing carbon fiber on the Cybertruck’s exterior to help with overall performance and strength. As previously mentioned, Tesla used aluminum to protect the underside of the body, but it is pretty typical for the company to continue making engineering changes that will improve the car in the future.
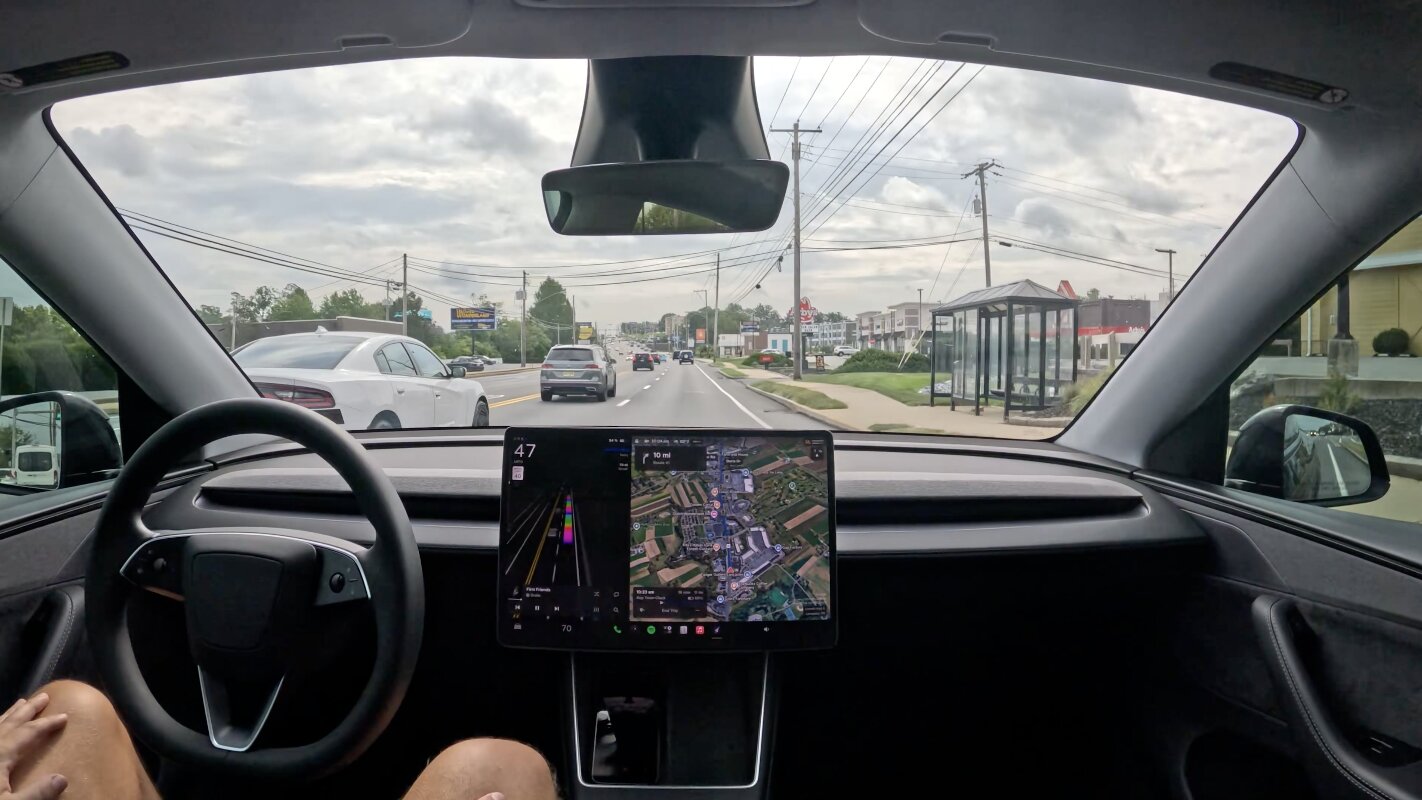
Tesla released Full Self-Driving version 14.3.7 yesterday, and after about 90 miles of testing today, it is evident there are some definite fixes from version 14.3.6, which I wrote about last week and called a regression.
Within the first 40 minutes of my drive on v14.3.7, it saved me from getting into an accident with an unaware Dodge Charger driver, and some of the things Tesla seemed to miss in v14.3.6 were definitely improved. All in all, the release so far has some really great performance, and I’m looking forward to testing it further.
For now, here’s everything I noticed with v14.3.7:
Overall Improvement
Just generally speaking from a ride perspective, this was a really great experience. A lot of the hesitancy I experienced on v14.3.6 was gone. There were no instances of brake-stabbing, wheel-jerking, or any uncertain or unconfident movements. It was void of anything that I felt made it timid with v14.3.6.
The one thing I do hope to see down the road is a smaller need to adjust Speed Profiles so often. Because Tesla calls FSD “Supervised,” I’m okay with needing to hit the scroll wheel a few times a drive.
However, I hope that things can be incrementally improved upon with speed. Sometimes it’s too fast; other times it’s too slow. It’s a difficult thing to hone in and refine, but I hope it eventually gets there.
I didn’t notice any significant left lane camping or any behaviors that were completely out of line. I am hopeful that this opinion does not change, but after driving a few days with this version and putting it in a variety of different situations, you are exposed to more behaviors, some of which are not necessarily what I’d prefer.
-
The big things to notice, at least in my experience thus far, are that the major issues with previous versions — meaning the braking stabbing and wheel jerking — simply weren’t there. That’s enough to already consider this progress compared to .6.
Manual Signal Override is More Responsive
On .6, I had quite a few issues with FSD ignoring my manually input turn signals. If Tesla wants to call it “Supervised,” then the car should not ignore any input the driver gives. If I touch the accelerator on FSD, the car speeds up.
🚨 Tesla FSD v14.3.7 obeying manual turn signals https://t.co/6eqToXpQfC pic.twitter.com/vHBlFQ4PDV
— TESLARATI (@Teslarati) August 2, 2026
The car did a great job of obeying my turn signals when I wanted it to change lanes, which is welcome.
Parking Lot Performance
Before .6, I traditionally took over in nearly every parking lot my car entered, because I knew it would not park somewhere that I wanted, and usually, it was just a tad too timid in this setting.
The one bright spot of .6 was how well it handled parking lots. This continued with v14.3.7:
-
I’m always really happy to see progress at all, but once parking preferences come to FSD, as long as this performance is still around, that could potentially be the biggest improvement I’ve seen in FSD in the year I’ve been using it personally on a daily basis.
Full Self-Driving Averts Disaster
A Dodge Charger changed into my lane without checking if I was there, running me off the road. FSD made the initial avoidance maneuver; I grabbed the wheel out of instinct, looked in my side mirror to ensure I had nobody following closely behind, hit the brake, and straightened the car back up to avoid a curb:
🚨 Guys this is why you all NEED to stay vigilant behind the wheel, even on Tesla Full Self-Driving
Human drivers are UNHINGED and have no idea what they’re doing anymore. This was a kid obviously younger than 20 years old with zero awareness.
First drive with v14.3.7 https://t.co/1vTbCMpCn8 pic.twitter.com/lz7KKEF6bj
— TESLARATI (@Teslarati) August 2, 2026
-
There have been quite a few responses to this video stating that I should never have grabbed the wheel. To be honest, I really wish I had not done so, because I do believe FSD would have avoided any sort of collision with anything, including the car or the curb.
However, this was the first time I had ever been this close to being hit while using FSD. My natural reaction was to take over. I think if I had had something like this happen before, my reaction might have been different.
Hitting the brake avoided hitting the curb, while FSD swerved to avoid the car. My concern after the car was clear of my front end was the curb. All in all, I’m really happy with how things turned out, and I think anyone could be a critic of how I handled it. I only had a split second to really make a decision, and thankfully, any damage was avoided.
It is clear FSD managed to avoid the car coming down before I was able to. I truly credit FSD for avoiding the collision.
What Needs to Improve
Better Recognition of Potholes, Uneven Roads, Sharp Changes in Roadway/Bumps
On Friday, my Fianceè and I were in the car, and FSD was driving us. We crossed over a roadway that has a traffic light, and FSD was traveling at 40 MPH on Standard, 5 MPH over the speed limit. Everything was more than reasonable.
However, the road we were crossing at the light has a major bump both as you start and finish crossing it. Without a speed reduction, your car can go airborne. The Tesla did just this on Friday on v14.3.6; it was an uncomfortable bounce that pretty much confirmed I would not ever let FSD go over again unless we were sitting at that intersection when there is a red light.
I even tried scrolling down into Sloth quickly, but I ended up just taking over:
-
This is that big bounce that I mentioned in the quoted post.
It’s just a tad too drastic to take at the speed FSD wants to go over it. You can see me quickly swipe down into Sloth, but I intervened. https://t.co/K20PK9ysBg pic.twitter.com/81Oc82ZJcZ
— TESLARATI (@Teslarati) August 2, 2026
A few people have said it remains related to the vision-based approach and its difficulty comprehending 3D. This is a huge issue because this can cause serious damage at certain speeds.
Navigation
Nothing new here. I still turn off “Online Routing” quite frequently to get the car to take logical routes from time to time.
Auto Wipers
Auto Wipers are just plain bad. I really hope Tesla just uses a rain sensor. I thought they had improved at one point, but I still get dry wipes, Speed 4 on a drizzle, and Speed 2 on a steady rain. In reality, these should be switched.
You can watch our full review of Tesla Full Self-Driving v14.3.7 below:
-
🚨 Tesla Full Self-Driving v14.3.7 saved me from an accident! FULL REVIEW: https://t.co/1vTbCMpCn8 pic.twitter.com/9mHmKVoMVA
— TESLARATI (@Teslarati) August 2, 2026
SpaceX will report second quarter results after the market closes on Tuesday, August 4, marking the first time the company has opened its books to the public since its record IPO in June. Management will host a live audio only webcast at 4:30 p.m. ET, streamed on X, with no dial in option.
The debut carries more weight than a typical first quarter as a public company. Two trading days after the release, on August 6, the first tranche of SpaceX’s lockup expires, freeing roughly 911.5 million insider and employee shares, worth well over $100 billion at current prices and the largest such release in Wall Street history. A second, larger tranche tied to the stock trading 30 percent above its $135 IPO price never triggered, since shares have spent most of July trading below that price.
Wall Street’s models point to revenue near $6.9 billion for the quarter, up sharply from the $4.69 billion SpaceX reported in the first quarter, with a narrower per share loss than the $1.27 posted three months earlier, according to estimates compiled by Motley Fool. Those numbers will be the first look at how SpaceX’s three segments, Starlink, launch and AI, are performing independently.
SpaceX scores another massive Pentagon deal to support military satellites
Investors heading into the call have a specific list of questions. How many net new Starlink subscribers did SpaceX add after ending March with 10.3 million, and is average revenue per user holding up as the service expands into lower income markets. How much of the AI segment’s revenue reflects contract signings with Anthropic, Google and Reflection AI this year, deals that combined could annualize to nearly $28 billion if fully ramped. Whether capital expenditures, which nearly doubled in the AI segment alone between 2024 and 2025, are still accelerating or starting to plateau. And whether management offers any forward guidance at all, something SpaceX has never done publicly.
The report will also land days after Elon Musk publicly denied a Wall Street Journal report describing internal planning to separate Tesla’s China business ahead of a potential Tesla-SpaceX merger. Whether Musk or SpaceX executives address that speculation on the call, even indirectly, maybe something investors will be listening for on Tuesday.
As Teslarati reported after Musk’s own warning to short sellers last week, the CEO has made clear he expects skeptics to be proven wrong over time. Tuesday will be the first chance for the numbers themselves to make that case.
-

Tesla quietly made the Cybertruck even stronger

Tesla Full Self-Driving v14.3.7 early review: FSD saved me from an accident


