News
Tesla’s Supercharger – The Cost of Giving Away Free Energy
Tesla Motors (TSLA) investors worry if the company will survive quarter to quarter based on Tesla’s financials. Investors are concerned about wavering Government support, should political winds shift. Tesla stock plummeted recently when it was ‘discovered’ that their electric cars will stop all by themselves if driven past the point where the charge gauge reads zero. But investors pay little attention to how, specifically, Tesla might actually make a lot of money. And they should, because absent a solid upside, this high-priced, high-risk stock isn’t worth the money.
Tesla’s Model S has won prestigious awards and critical acclaim. It’s quiet, clean, nimble, fast and great looking. Customers are lining up to buy it and Tesla has figured out how to make the Model S. But for investors hoping this $35 stock will turn into a $100 stock, there is a huge, seemingly insurmountable problem ahead.
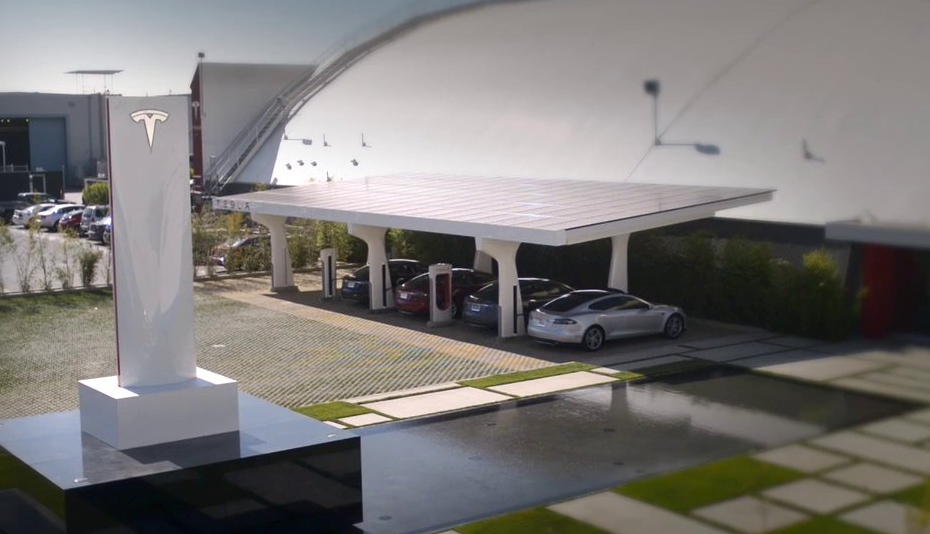
Tesla has taken a different path in electric car development than other car makers. From the beginning, Tesla has built every long range, very high performance electric cars for the high-end car market and used commodity Li-ion cells instead of purpose-built ‘automotive’ cells. The results have been amazing. Clearly Tesla got it right and rivals got it wrong. In the next 2 – 3 years, Tesla is poised to unveil their Gen III car leveraging the latest advances in Li-ion batteries. Gen III cars will directly compete with mid-range, mainstream sedans on price and performance and will be disruptive because these cars will cost less to make than comparable ICE cars forcing automakers to shift from ICE to electric car manufacture. Tesla has a lead of perhaps two years over mainstream car makers in electric vehicle technology and all they need to do is use that two-year window to establish industry dominance. And right there is the problem for Tesla shareholders. For Tesla to convert their technical edge into auto industry dominance, they will need to make lots of cars. Doing that will require lots of new capital, and if Tesla raises that much capital in the next 2 – 3 years, it will dilute existing shareholders. This may make Tesla fantastically successful, but existing shareholders won’t profit much. And the alternative of selling out to Toyota (TM) or Daimler (DDAIF.PK) won’t make Tesla shareholders nearly so rich as they deserve. There is a strategy for Tesla to ‘run the table’ that requires almost no new capital and can bring Tesla investors truly outsize returns. The market seems ignorant of what this strategy is, how it works and that Tesla appears, if you look closely, to be pursuing it even as we speak. Let me digress a bit. Tesla has lauded use of solar panels on their SuperCharger stations and they will give away energy at SuperCharger stations to Tesla owners, forever. Because the solar panels on a SuperCharger station cannot generate enough energy to recharge even one car per charging slot per day; because there is no such thing as a free lunch; and because a prudent investor should understand companies in which he invests, I have looked hard at what Tesla is doing. After studying utility tariffs, traffic rates past SuperCharger stations, queuing and congestion effects, actuarial costs of supplying ‘free’ energy to Tesla drivers and Tesla pricing, I have figured out how Tesla can make money giving energy away. Tesla can make a lot of money giving energy away at SuperCharger stations, not just to owners of Tesla’s cars, but also to owners of SuperCharger compatible cars produced by Tesla partners / licensees. In fact, Tesla can make more money giving energy away than they can building cars. They can do it without diluting existing shareholders. And, they are already headed down this path. We begin with a SuperCharger business model, the assumptions going in and the projected impact on Tesla’s share price. I’ll describe the details of the model and the evidence for Tesla having embarked on this path later on. The SuperCharger business consists of collecting an up-front fee on each car and using these fees to build and operate SuperCharger stations that provide unlimited, free road-trip recharging. Tesla charges $2,000 for optional ‘SuperCharger Compatibility’ on their 60kWh car today so a $1,500 fee used in our model is less than what customers are paying right now. In the modeled business, both Tesla and their partners / licensees pay the $1,500 fee for every SuperCharger compatible car they make. Our model involves only the US market and covers the time frame through 2024. Three cases are modeled (Low, Mid, High) that represent varying degrees of market success for Tesla and their partners. The model predicts the change in Tesla’s share price based on incremental after tax income and an assumed forward PE that varies with degree of ‘market success’.
Partner SuperCharger participation will drive Tesla shares. In the model we assume Tesla partners Toyota and Daimler, and additional licensees, begin building a few Model S like cars in 2016 and offer cars similar to Tesla’s Gen III cars later on. The model assumes 120,000 unit Tesla production (Gen II and Gen III) US market cars in 2024 for all the modeled cases – This model only explores SuperChargers as an element of Tesla’s business and the effect of Tesla partners/licensees selling cars compatible with SuperCharging. It does not attempt model Tesla’s car manufacturing / sales business. Each of the cars, whether from Tesla or a licensee pays the $1,500 ‘fee’ into the SuperCharger program and receives free road-trip recharging for the life of the vehicle. Burying the SuperCharger cost in the vehicle price and delivering ‘free’ recharging is powerfully competitive for the following reasons:
- Tesla can encourage participation and SuperCharger compatibility as a condition for partners and licensees accessing Tesla’s best-available EV technology.
- The synergy between Tesla style battery design, thermal control, SOC management, and SuperCharger functionality naturally precludes cars of different design using the system.
- SuperCharging at a price of ‘free’ leaves little room for competing fast recharge service providers.
The rapid-recharging business offers at least as great an opportunity for Tesla as the electric car business. While Tesla’s advanced electric car technology and IP gives them competitive advantage in the car business, Tesla would need to raise vast amounts of capital and displace powerful, established incumbents before reaping the benefits of industry dominance building cars. By building only enough cars to demonstrate the superiority and lower costs of their technology, licensing partners, then taking on the rapid-recharging business, Tesla can grow dramatically without having to compete against existing car companies and without needing to raise outsized amounts of new capital. Pursuing the SuperCharger business, leveraged by their electric car expertise, IP, large car maker partners, and innovative ‘free’ pricing, positions Tesla to dominate the rapid-recharging business and profit from disruption as electric motors and batteries replace ICEs and gas tanks. While their partners and licensees drive disruption of the car business, Tesla can make a bundle for their shareholders by dominating the rapid-recharging business that enables electric car road trips. The following chart illustrates how partner / licensee cars contribute to projected sales volumes for the Low, Mid and High cases in the model and how this drives the Tesla share price. (click to enlarge)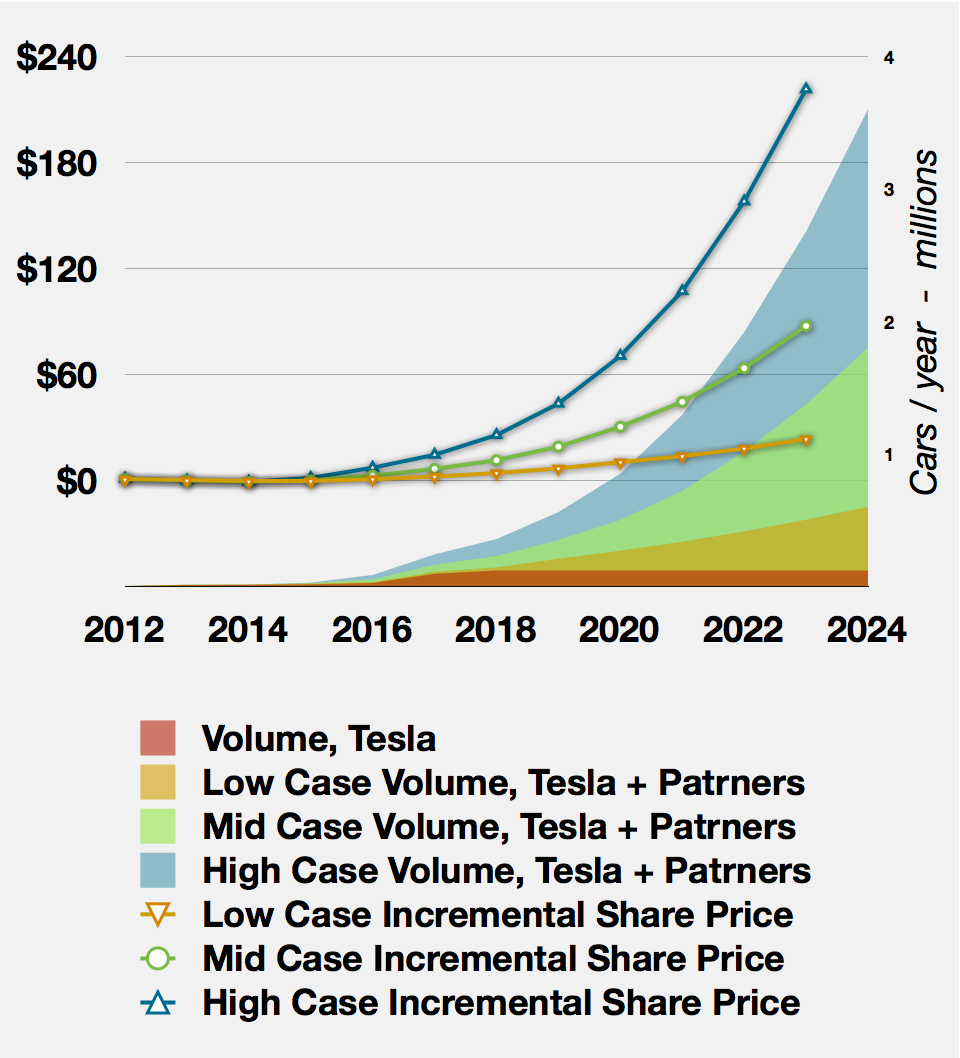
SuperCharging for partner / licensee cars will drive Tesla share price.
This model predicts very dramatic increases in the price of TSLA going forward, and at this point, I want to stress as author of the model that I am neither a CPA or qualified/licensed financial advisor, but merely a Tesla investor that has taken time to understand what may be one aspect of Tesla’s business. No one should make decisions regarding an investment in Tesla on the basis of this article or the model results presented. While the presented results do reflect my view and understanding of this potential aspect of Tesla’s business, neither the accuracy of the model or the veracity of my opinion are guaranteed. Do go talk with somebody else before you invest in Tesla… Having said all of that, some readers may wish to fully understand what was modeled, what assumptions were made and what are some of the information sources used. Description of the Model Our model begins by spreading the up-front $1,500 ‘fee’ paid in conjunction with each new SuperCharger compatible electric car over an anticipated life (15 years) and assumed road-trip usage profile. The CapEx, O&M expense, traffic capacity and operating margin characteristics of a ‘nominal’ SuperCharger station are derived based on reported traffic data, a statistical queuing model, current utility rates and observations of Tesla’s Tejon Ranch SuperCharger station. For purposes of the model, all SuperCharger stations are copies of this ‘nominal’ station. Build out of SuperCharger stations proceeds to a total of 100 stations by 2014 and thereafter station build proceeds differently for each case (Low, Mid, High) depending on the sales / fleet size of SuperCharger compatible electric cars such that the system-wide utilization is kept well below the rush-hour congestion limit. Revenue is recognized against SuperCharger visits while the cash received as new SuperCharger compatible electric cars are built is used to pay for station CapEx net of incentives with the remainder held in account against future obligations to supply recharging service. Recognized income is applied against station O&M, purchased energy costs and an allowance for G&A to yield EBITDA. Depreciation, incentives/credits and interest are then applied to obtain EBT. A 30% allowance is made for tax and the resulting net income is multiplied (forward-looking) by the assumed P/E (10, 15 or 20 for Low, Mid, High cases) to obtain the incremental share price based on 113,000,000 shares outstanding. At this point, I apologize to any accountants and MBAs in the audience. Finance is not my specialty and this engineer is muddling ahead as best he can. Valuing SuperCharger Usage The SuperCharger business – that is the provision of ‘free’ road trip recharging in the future in exchange for a one-time up-front fee – is like selling annuities. We need to understand how many SuperCharger visits a car is likely to make over its lifetime and what those SuperCharger visits are worth at the time they occur based on the fee paid up-front. NHTS data shows, 16% of passenger car miles are for trips over 100 miles and that the average length of such trips is 215 miles. Older cars on average travel fewer miles and, of course, cars wear-out and crash, so over time fewer and fewer of cars initially sold remain in the fleet. NHTS has developed estimates [Table 1] of vehicle miles traveled for passenger cars of varying age, taking into account both survivability and reduced utilization with age. Taken together, the NHTS data gives the number of trips over 100 miles that a car makes, on average during each year of its life. (We make the assumption that the fraction of miles driven that are on trips over 100 miles remains constant over a car’s life…) The remaining question is how many SuperCharger stops will be made on the average trip? Obviously, some trips are longer and some shorter and many trips over 100 miles will not require a Tesla style electric car to recharge at all. Longer trips will require recharging, in some cases, several times. To understand this effect, we use an exponential fit for Road Trip frequency based on ‘road trips’ being any trips between 100 and 800 miles, with the average trip length 215 miles (from NHTS data). We further assume trips are begun with a well charged battery and, on average, the driver goes 170 miles before stopping at a first SuperCharger and stops to partially recharge again every 130 miles, or until reaching the destination. The following chart illustrates how this works. The average number of SuperCharger visits made on a trip of more than 100 miles is 0.824. (click to enlarge) 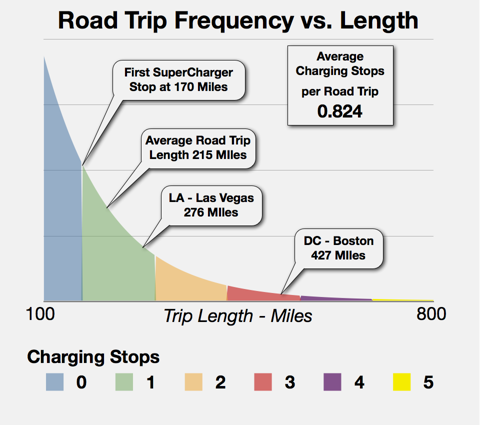 Shorter road trips are more common than longer road trips and for trips shorter than the range of an electric car, recharging along the way will not be needed at all. The average new car makes ~10.5 trips of over 100 miles the first year based on NHTS data and if Tesla style electric cars are used in the same way as conventional ICE cars, they would be expected to visit a SuperCharger station just under 9 times during their first year. Of course, buyers of electric cars with good range and free road-trip recharging should not be counted on to be average. A car that comes with unlimited ‘free fuel’ for road trips is likely to appeal, to some degree, to people wanting to take long trips – even if the car is an electric car. To allow for this and other unforeseen effects, our model assumptions are more conservative than the NHTS data. We assume that the average new SuperCharger compatible car uses a SuperCharger 12 times in its first year and that aging and attrition reduce SuperCharger visits by 7% per year over a 15-year vehicle life. The resulting visits are then discounted to the time of sale at 6% per year to give a discounted number of visits which are then used to apportion the initial $1,500 fee against the car’s future SuperCharger visits. The result is that our model values a SuperCharger visit at $18.14 at the time the visit occurs. The following figure illustrates the number of SuperCharger visits a car will make over time – Bars indicate models assumptions, the line indicates the SuperCharger visits expected based on NHTS data. (click to enlarge)
 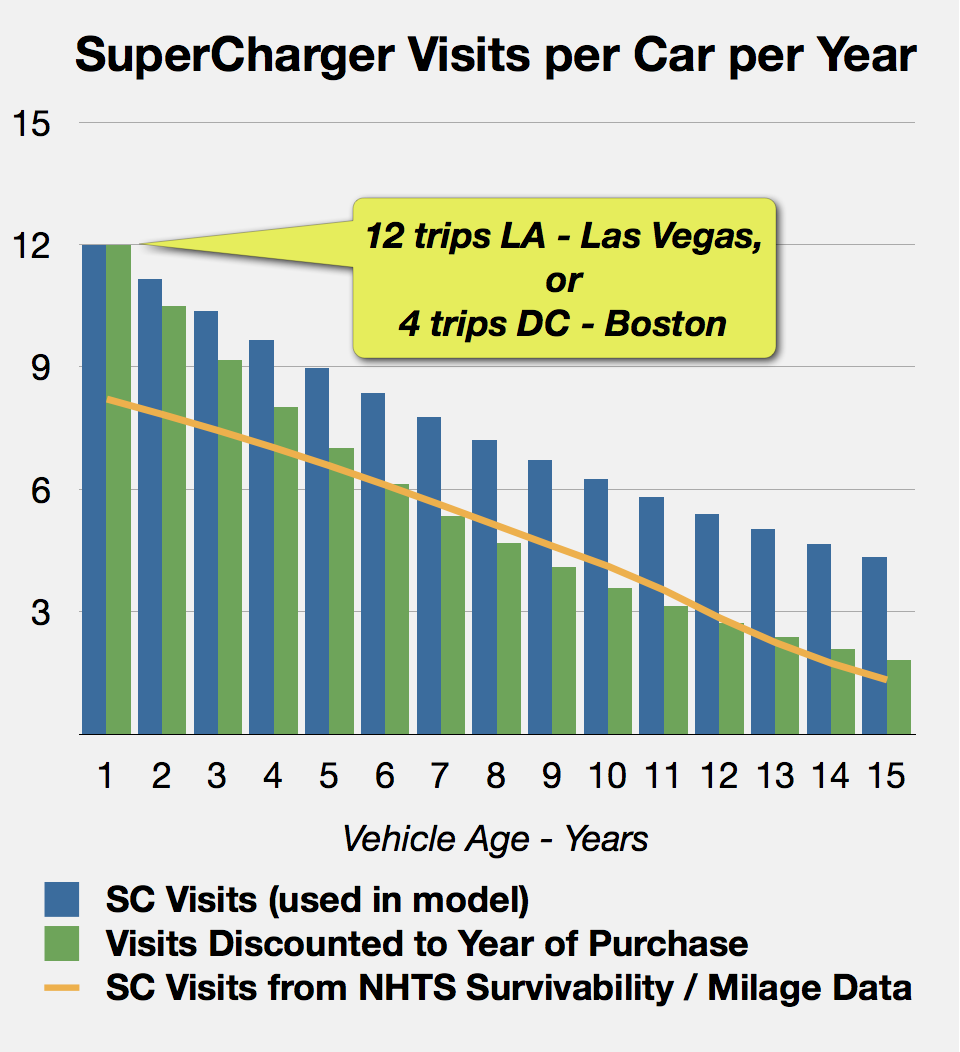 Older cars travel less and future SuperCharger visits are worth less than visits occurring today. The model assumes SuperCharger usage substantially higher than NHTS data predicts. Now that we have ‘valued’ a SuperCharger visit, we also estimate that most of the cars using the system will be similar to the Gen III car described in the referenced article on Disruption and that 20 minutes of charger time and 40kWh of energy are used on average for each visit. SuperCharger Station Characteristics
A SuperCharger station uses a lot of power when it is charging cars, but most of the time it just sits there. Peak power use is much higher than average use and station economics get ugly if the utility imposes demand charges. Keeping peak station power draw within the ‘small user’ category avoids demand charges, but limits the station to 3 x 120kW chargers or 4 x 90kW chargers (the case for a typical utility). Solar panels don’t really help the peak demand because their output is small (~30kW peak for the panels on a 3 charger/6-parking space SuperCharger station).
As we will see in a bit, a 6 charger station can service more than twice the cars a 3 charger station can before drivers have to wait to plug-in. Adding a large battery to the SuperCharger station will allow us to level out demand and operate 6 chargers while only drawing power for 3 chargers from the utility and getting the rest of the needed power from the battery. The battery can then be recharged from the grid when fewer than 3 cars are being charged. The problem of course is that this battery is expensive. Conveniently, the battery can be used to store power when rates are low and return it to the grid when rates are high (rate arbitrage), to store energy at low rate periods for use charging cars at other times, or to supply ‘stabilization services’ to the grid. Any and all of these things help to economically justify the battery.
 -
-
Off-Peak Renewable Energy and Rate Arbitrage
The value of electricity varies with time and location. Utilities frequently impose ‘peak rates’ during certain times of the year/day. The PG&E rates applicable at Tesla’s Tejon Ranch SuperCharger location are an example. In many areas wind generation that is highly variable is beingcurtailed and the energy literally thrown away because the grid cannot utilize the wind generation peaks that could be captured by large batteries at SuperCharger Stations. Glenn Doty posted an article on Seeking Alpha last year that explains how wind curtailment is a problem that will increase in significance as more wind generation is added to the grid. During wind curtailments, the cost of energy can actually be negative.
‘Nominal’ SuperCharger Station (click to enlarge)
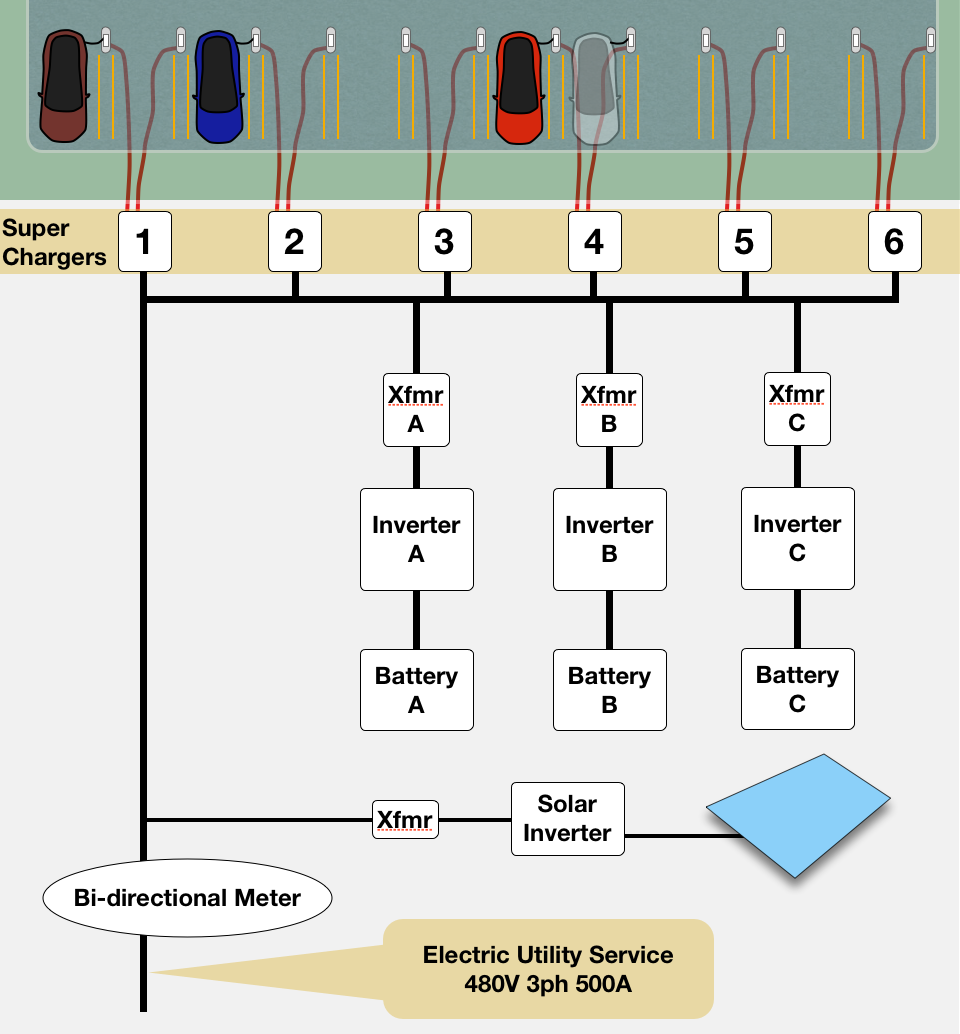
The SuperCharger Station Has Batteries & Inverters and Can Exchange Power with the Grid for Arbitrage, to Capture Minimum Rates, or to provide Grid Stabilization Service, any of which can offset energy costs for recharging cars.
For purpose of our model, the ‘nominal’ SuperCharger station operates against the PG&E A-6 rate tariff with Net Energy Metering (to which it would be entitled due to its grid-connected solar panels). The battery-inverters are used to arbitrage off-peak power to summer on-peak rates at up to 2 MWh/day 120 days/year to offset energy costs. The battery-inverters are also used to permit all six SuperChargers to operate while keeping the peak draw from the utility to less than 360 kW (or 433 Amps @ 100% PF)
Traffic Capacity, Operating Margin, Utility Rates & a Battery
To understand how many SuperChargers will be needed as more cars are sold, a random arrival, random service time statistical M/M/c queuing model was used. Using traffic data at Wheeler Ridge on Interstate 5 in California (Tejon Ranch SuperCharger station) peak hour traffic was estimated to be 2.5 x average traffic. Charging station capacity was set based on traffic that would give a 1% chance of not finding a vacant charging space on arrival during peak-hour conditions. This chart shows congestion performance of a 3 charger and a 6 charger station. The 6 charger station can service ~2.7 times the traffic for the same degree of congestion, so adding the battery to the charging station more than doubles capacity without requiring a larger (and demand charged) utility connection.
-
(click to enlarge)

With a battery and 6 chargers, 2.7 times the traffic can be serviced from the same ‘small user’ utility connection.
The battery and inverters allow the station to take power from the grid during summer off-peak ($0.13768/kWh) and return it to the grid summer on-peak ($0.48657/kWh). This ‘rate arbitrage’ and energy from the station solar panels offset total energy costs for servicing ~36 cars per day. Energy purchases to service additional vehicles can be effectively made at off-peak rates.
Gross operating margin for the charging station was computed based on the recognized revenue amount of $18.14 per SuperCharger visit and allowing for $62k of annual station O&M expenses. Not only does the station with 6 chargers and battery handle 2.7 times the traffic, it realizes higher operating margins at all levels of utilization.
(click to enlarge)
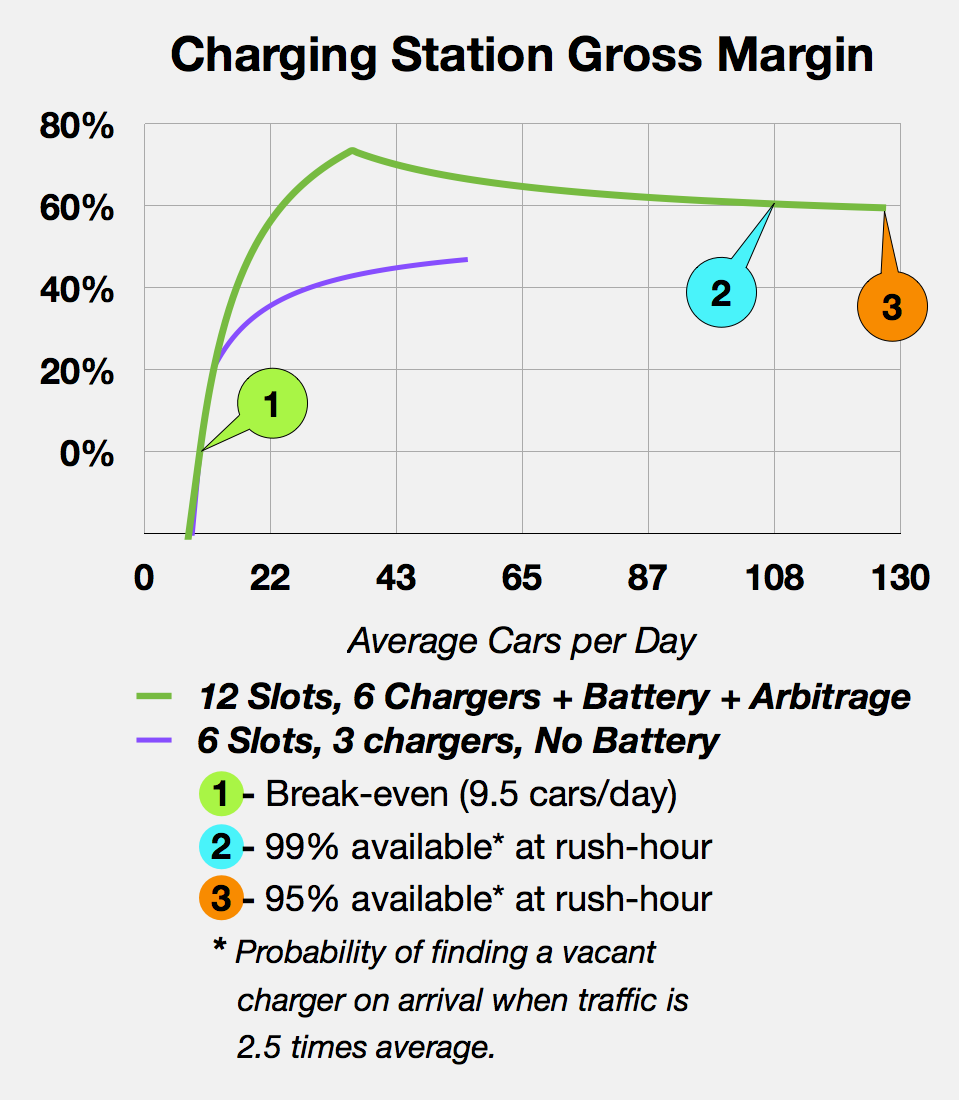
The ‘nominal’ SuperCharger station with 12 slots, 6 chargers and battery-inverters that perform rate arbitrage operates at higher margins over a wider utilization range than a simple 6 slot, 3 charger station while using the same ‘small user’ utility connection.
SuperCharging stations are not like gas stations. Charging takes longer (15-30 minutes) than filling a gas tank and the electric car driver wants to plug-in and then go have lunch, visit the restroom, etc. If the driver has to wait for a charging slot to become available, it is inconvenient and perceived as lengthening the charging time. It is important that SuperCharger stations be built out quickly, not only to cover more travel routes, but also to minimize any congestion effects and resulting poor experience for electric car drivers.
-
Note: For purposes of our model, SuperCharger station economics are modeled on the specific electric tariffs that apply at one SuperCharger location. Different locations served by different utilities and ISOs will have different tariff structures offering both different rates and valuations for entirely different station functionalities – ancillary grid stabilization services under MISO, for example. Our assumption is that overall and on average, station economics will be similar to our model.
System Build-Out
Providing SuperCharger stations to enable Tesla (and partner / licensee) electric cars to make practical, convenient road trips is a chicken-and-egg problem. Initially one must build some minimum number of stations to cover a few, major routes even if there are not enough cars to effectively use the combined capacity of these stations. Tesla has said they plan to build about 100 stations in the next couple of years and our model reflects this initial rate of build-out. As combined Tesla / partner / licensee production increases (Gen III introduction and on) our model continues to ‘over-build’ new stations with the idea of expanding route coverage and minimizing congestion effects along busy routes, reaching a system wide utilization of only 70% in 2024 even under ‘high-case’ assumptions. Remember even at 100% utilization and rush-hour conditions, a Tesla driver will have a 99% chance of finding a vacant charging slot upon arrival.
(click to enlarge)
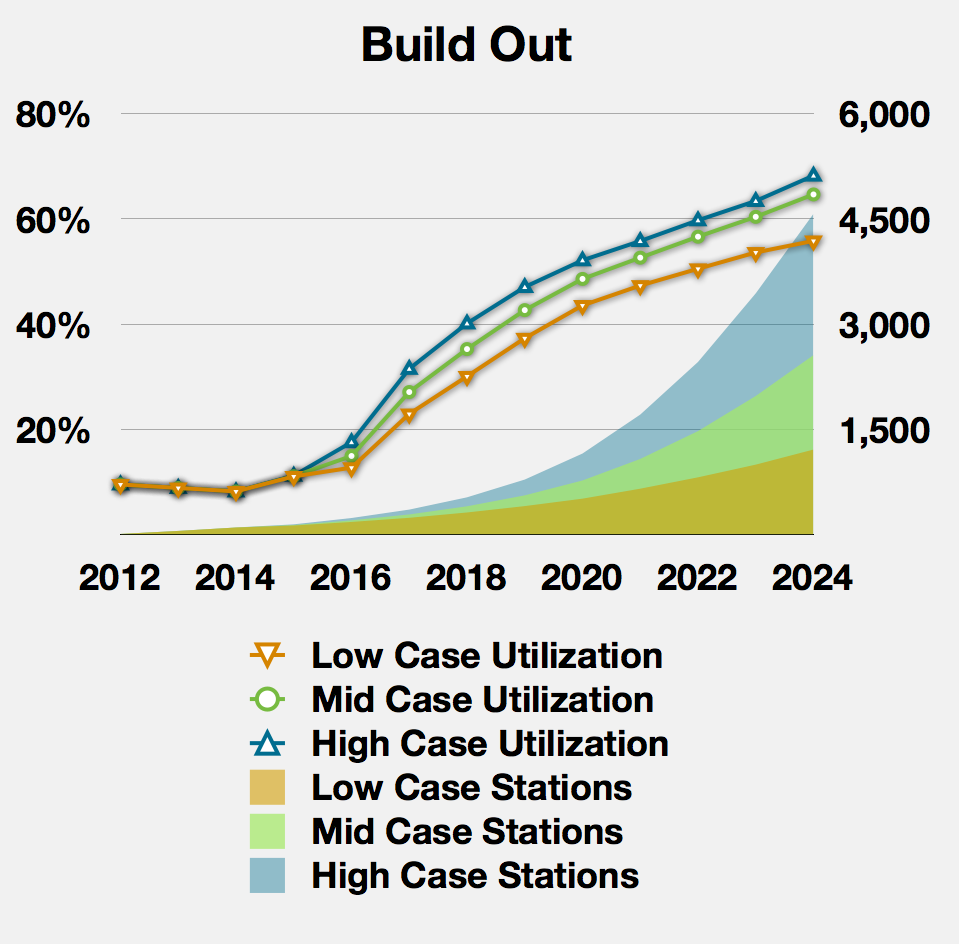
SuperCharger stations are built-out faster than simple traffic growth requires both to support expanded route coverage and to insure drivers using stations experience minimal congestion inconvenience.
An important aspect of SuperChargers that is different than gas stations is that many more ‘charging slots’ than ‘pumps’ are needed to support a given level of traffic using the station. At a very busy recharging point like Wheeler Ridge on Interstate 5 in California (Tesla’s Tejon Ranch SuperCharger location) the high-case model would see several hundred slots and several ten’s of SuperCharger stations spread among the many business establishments at this busy location. At this level of SuperCharger deployment, finding a free charging slot will take more than driving to a station and ‘eyeballing’ a vacant space. A system using each Tesla’s wireless connection that allows drivers to choose and reserve a charging slot while approaching the charging location is an obvious solution. Our model includes $1500 / month of O&M expense per SuperCharger station to support such a ‘back-end’ system.
Costs
-
There are two types of cost associated with a SuperCharger network, CapEx and O&M. It is important to distinguish between these costs because they will be accounted and paid for differently in our model.
The capital cost for one ‘nominal’ SuperCharger station is estimated at just under $1.2 million. For purposes of our model, a combination of incentive payments and tax credits equal to 35% of the gross capital expenditure are assumed to be available and that with appropriate ‘financial engineering’ these incentives and credits are realized as cash at the time each station is built. For stations built early on, a higher percentage of incentives will likely be available but such initial incentives are not included in our model. (The California Self-Generaton Incentive Program for instance would provide more than $600k additional incentive based on the ‘rate arbitrage’ functionality of the station, subject to total SGIP expenditure limits.)
The other element of station cost is operating expense which includes maintenance and ownership cost, plus the cost of electricity purchases. The Charging Station Gross Margin relationship which places these costs against the recognized income of $18.14 per car charged is used in the model, based on the system-wide Utilization to compute gross profit.
The following figure illustrates the breakdown and coverage of CapEx and O&M costs associated with each ‘nominal’ SuperCharger station.
SuperCharger Station CapEx and Operating Cost (click to enlarge)
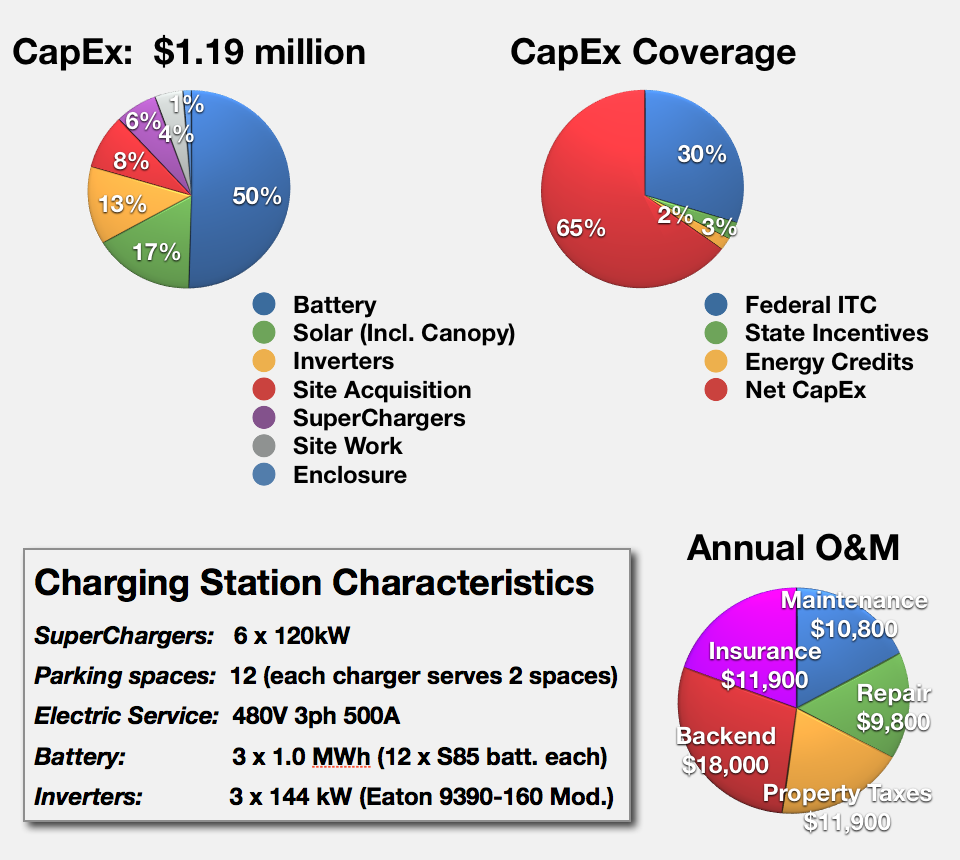
In our model, O&M costs appear directly in the calculation of profit and loss, but CapEx appears only by way of depreciation expense – as is the conventional accounting approach. Because the battery is the dominant element of station CapEx, the battery life must be considered when setting the depreciation schedule. For our model, we assume that the battery is made of 18650 cells similar to those Panasonic is using for load-leveling batteries sold in Europe and which Panasonic advertises as having 5,000 cycle life. In our ‘nominal’ SuperCharger system, these batteries are operated over only a 10% to 77% SOC range and the maximum charge / discharge rates are less than C/5 suggesting that Panasonic’s advertised cycle life may be achievable. Assuming that our battery is cycled once a day, it should last 13.7 years. To be very conservative with regard to any calendar life issues, the battery and the rest of the station are depreciated straight-line over seven years.
Revenue
-
Revenue – the $1,500 fee paid for each SuperCharger compatible car – is heavily front-loaded and because receipt of these payments is accompanied with an obligation to supply future charging services it is not treated as ‘income’ at the time it is received.
Income Recognition, Depreciation, Credits, G&A, Taxes
Income in our model is recognized at the time cars visit SuperCharger stations at the actuarially determined rate of $18.14 per visit. Gross annual profit is determined from the annual number of SuperCharger visits, the system-wide station utilization and the station gross margin curve. G&A expense equal to 10% of the recognized revenue is then applied to obtain EBITDA. Depreciation, interest on the cash reserve held against future charging obligations and the value of credits and incentives, lumped to time of construction for new stations, are applied to obtain EBT. Income tax in the amount of 30% of current year income is made with no allowance for prior year accumulated losses to arrive at net income. It is on the basis of this net income amount, the assumed forward P/E (10,15, or 20) and 113,000,000 shares that the estimated effect of the SuperCharger business on Tesla’s stock price is made.
Presumably an enterprising Tesla CFO might argue for booking a portion of the $1,500 up-front fee as a ‘sign-up charge’ and hold the remainder as cover for the future obligation. That would of course, bring significantly more to the bottom line, sooner and all other things being equal, drive the stock price higher, earlier on. Similarly, using a depreciation period closer to the anticipated battery life would up profits and stock price toward the front end. But for either of these financial engineering possibilities, our model has chosen the more conservative approach.
Indications of Tesla’s Intent
Investors reading this may justifiably ask whether any of the forgoing is real, or simply a figment of the author’s imagination. Fair enough. Here is what I have observed that supplements the argument smart people like Elon Musk and his Tesla crew would not set out to disrupt the car business and the oil business without having figured out how to profit from the experience in a serious way.
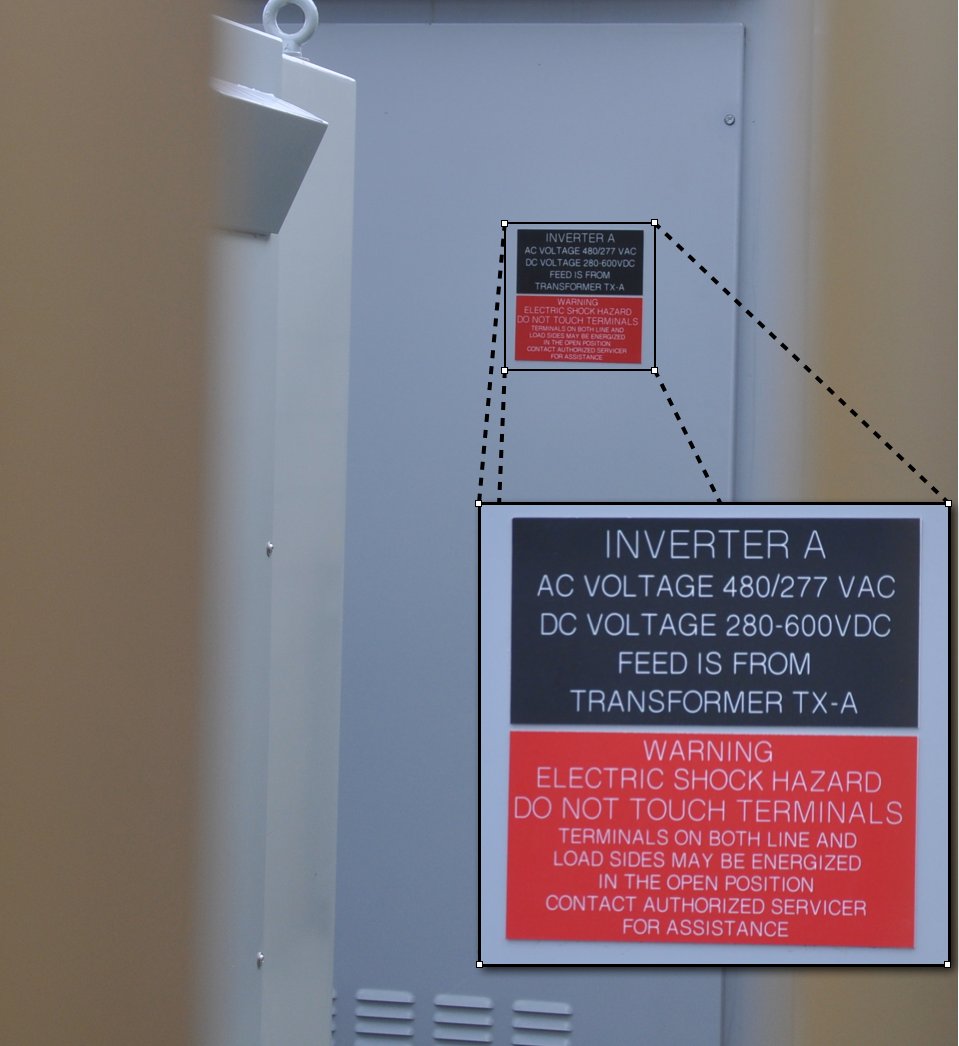
My evidence of Tesla’s specific intent centers on the level of effort and sophistication going into their SuperCharger stations. Let’s begin with a video tour of Tesla’s Tejon ranch SuperCharger station posted on YouTube by user ‘ednixon.’ Toward the end of this video, we get to see the interior of the yet to be finished electrical systems enclosure supporting the station. Note particularly the several large, grey enclosures with the word “Eaton.” These boxes are not the SuperCharger supporting the two charging slots operational when this video was taken. The SuperCharger is the white enclosure with the number “9,” which is its “unit number.” Tesla SuperSharger unit #11 can be seen in this picture of the Milford Connecticut SuperCharger Station.
-
If the gray “Eaton” enclosures aren’t SuperChargers, could they be something else? Well, they could be large industrial inverters of some kind – say like a modified industrial UPS. Eaton even makes such a device, even a version designed for harsh marine environments.
I recently visited Tesla’s Tejon Ranch SuperCharger station. The electrical system enclosure appears complete, but some things are visible through the security doors.
(click to enlarge)
(click to enlarge)
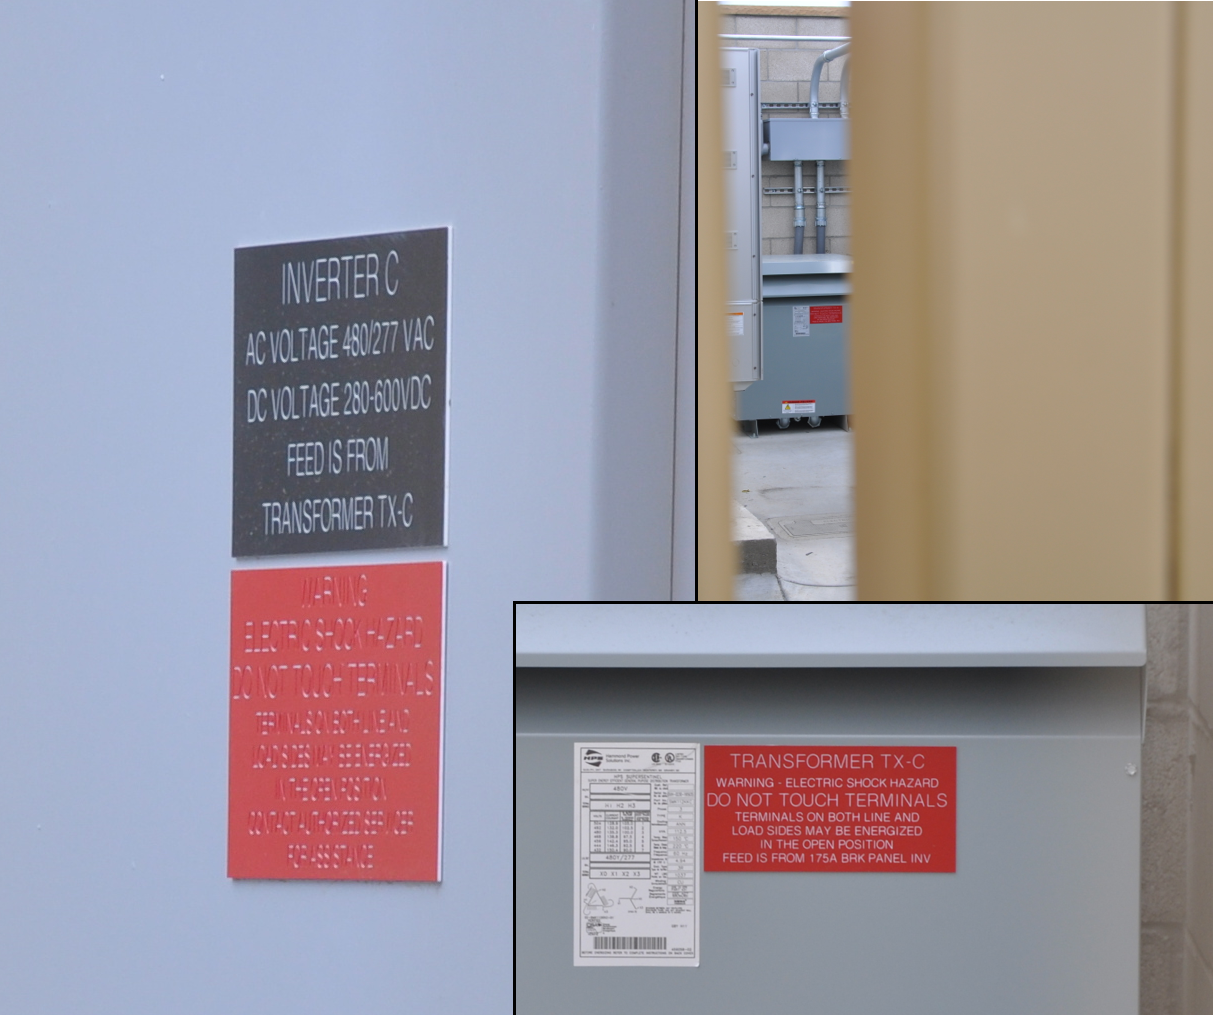
Altogether this does not prove or guarantee that Tesla will make it big in the rapid-recharge business. All it says is Tesla may have another path to outsize returns beyond making cars, and they are working pretty hard on building the infrastructure to support that non-car-building path.
If further confirmation of Tesla’s very serious intent toward the SuperCharger business were needed, George Blankenship, Tesla Vice President, Worldwide Sales and Ownership Experience announced yesterday (3/21) on the company blog “We’re also expanding existing locations like Harris Ranch, where we’re adding five more Superchargers in the next month.”
Making More Giving Energy Away
-
Earlier, I asserted that Tesla could actually make more money giving energy away through their SuperCharger network than they can making cars. Here’s how that argument goes. Remember, this analysis is only for the US SuperCharger business, so we only consider Tesla’s corresponding US car business.
If you are a great optimist, Tesla might be able to build the 120,000 cars for the US market in 2024 that we assume here without needing to raise significant new capital. If the ASP for those, mostly Gen III cars is $50,000 then Tesla’s US car sales would be $6.0 billion. If they were to make 25% GM and bring 10% to the bottom line, that would be $600 million net from making cars.
Our model, with very conservative assumptions, shows 2024 net profit at SuperChargers is $1.25 billion (high case), from giving energy away. And, that is double the projected net income for Tesla’s US car business…
Syndicated via Randy Carlson of seekingalpha.com
-

Tesla flexed the new features of the Model Y L with a dedicated media event at the company’s Diner on Santa Monica Boulevard in Los Angeles.
The Model Y L is the extended-wheelbase version of the all-electric crossover, which has been voted the best-selling car in the world on three occasions. The vehicle is already rolling off production lines at Gigafactory Texas, and first deliveries are slated to take place later this year.
Tesla brings Model Y L ‘Launch Series’ to the U.S. at $61,990
Teslarati was invited to the event, but due to some scheduling conflicts, we could not make it to Los Angeles. Instead, we will have our hands on a media unit sometime in August, so we’ll be able to spend some more extended time with the Model Y L.
However, plenty of those who made it to LA shared some cool features that set the Model Y L apart from the Model Y.
Multi-Row Climate Control
Tesla fitted the Model Y L with full climate control on all three rows on the front screen. It can be adjusted by selecting which row you’d like to modify on the right-hand side of the touch screen:
The Model Y L has a little row of icons on the right side of the climate screen so the front passenger can more quickly jump to whatever row they want to control. pic.twitter.com/uJS44mgCvk
— Sawyer Merritt (@SawyerMerritt) July 30, 2026
-
Better Rear Window Visibility
One of the strangest things about the Model Y, especially the Juniper iteration, is the rear window has extremely limited visibility when looking into the rearview mirror.
Tesla has improved upon this with the Model Y L:
This is a drastic difference. https://t.co/wTdhitD5aA pic.twitter.com/z6hFs0Jkss
— TESLARATI (@Teslarati) July 30, 2026
PowerShare will be included
Model Y L will come with PowerShare in North America, with an 11.5kW output to your home. Tesla said it would require Powerwall 3 for operation.
Wireless Charging Pad
There has been some speculation that Tesla would upgrade the wireless charging pads in the United States, but this is not the case.
-
Tesla owner fixes common feature complaint with crafty DIY retrofit
Tesla confirmed that it does not come with the cooled pads as the Y L in China does. This is because North America has not adopted Qi charging yet.
Thermal Management Improvements
These improvements in the Model Y L were seen with thermal management:
- Up to 15% faster cabin cooling
- +23% thermal efficiency gained in hot weather, 7 miles of real-world range gained
- 8x more solar energy reflection off of glass roof
- 30% reduction in solar energy entering the cabin
Some of the thermal management improvements in the new Model Y L Premium:
• Up to 15% faster cabin cooling
• Up to 15 min faster cabin cooling in sunny conditions
• +23% thermal efficiency gained in hot weather +7 miles of real-world range gained
• +10 miles recovered after… pic.twitter.com/jZirFWFdtO— Sawyer Merritt (@SawyerMerritt) July 31, 2026
Demand
Tesla said the Model Y L is almost sold out in the U.S. It comes with
-
- 1 year of FSD Supervised
- 1 year of Supercharging
- 1 year of Premium Connectivity
- Free exterior paint color, interior, and wheel option at no additional cost
Tesla CEO Elon Musk took to his social media platform X on Thursday night to deny a ridiculous rumor regarding the sale of the company’s Chinese vehicle production plant, Gigafactory Shanghai.
On Thursday, the Wall Street Journal, citing sources familiar with the matter, claimed in a scathing new report that Tesla was exploring a potential sale of the entire China business in an effort to help bolster a potential merger between SpaceX and Tesla.
Musk immediately denied the rumor not once but twice, initially calling it “fake news,” and then calling it “absurdly fake news” in a separate post just a few moments later:
This is fake news
— Elon Musk (@elonmusk) July 31, 2026
The original poster of the Wall Street Journal article that Musk saw deleted the initial post sharing the headline and the rumored sale of Tesla’s China business.
This has never even come up in a discussion ever.
Absurdly fake news.
-People should assume news is fake until proven otherwise.
— Elon Musk (@elonmusk) July 31, 2026
The report seemed absolutely and unequivocally false to begin with; Tesla’s business in China is among the most important pieces of the company’s business. Not only does the factory supply vehicles for the domestic market, but also for various other markets in Asia and Europe.
China is also one of the largest automotive markets in the world, and Tesla has performed well there despite the robust competition.
The speculation regarding a Tesla and SpaceX merger has started to gain steam this year as the space exploration company went public just a month ago. There has been speculation that Musk will bridge all of his companies under one “umbrella company,” and analysts believe this could happen before the end of the decade.
The Tesla and SpaceX merger everyone is talking about is quietly building
-
This is the latest iteration of Musk’s very evident war on mainstream media. Reports regarding any of Musk’s companies are quick to get the dreaded “false” or “fake news” response from the CEO when they are unfounded.
Elon Musk
Tesla AI boss reveals how big Optimus is going to get
Tesla’s Optimus chief corrected himself on X, confirming a staggering 10 million robot production target.
![Tesla Optimus Gen 3 [Credit: Tesla]](https://www.teslarati.com/wp-content/uploads/2026/03/tesla-optimus-gen3-diner.jpg)
Tesla’s Optimus program has a new number attached to it, after Ashok Elluswamy, the executive who has run the humanoid robot program since June 2025, posted a three word correction on X Thursday, “Correction, 10 million robots.”
The line clarifies the long term annual capacity Tesla is building toward its planned second Optimus production line at Gigafactory Texas, a figure Musk has cited repeatedly since last year’s shareholder meeting.
The scale is worth noting, because ten million robots a year would mean Tesla building more units annually than most countries sell in new cars. Tesla has framed this as a second line, not the first. The buildout is happening in two phases: a roughly one million unit per year line inside Tesla’s Fremont factory, installed on the floor space vacated when Model S and Model X production ended earlier this year, and a much larger dedicated facility under construction at Giga Texas that broke ground on its first steel structure in May. That Texas facility is the one Elluswamy’s correction refers to, and is expected to reach volume production sometime in 2027.
Correction, 10 million robots https://t.co/0z4nyQNTzp
— Ashok Elluswamy (@aelluswamy) July 30, 2026
Tesla Optimus project fires up as Musk sees production line progress
Elluswamy took over Optimus from Milan Kovac last summer and has spent the months since talking up the program’s trajectory. Elon Musk has also floated the ten million figure at Tesla’s 2025 shareholder meeting.
-
Ending Model S and Model X production to make room for the first Optimus line was one of the more consequential manufacturing decisions in the company’s recent history, retiring two flagship vehicles in favor of a robot that has yet to enter mass production. Musk has previously estimated per unit production costs at $20,000 to $25,000 once Tesla reaches a million units a year, though he hasn’t said what that cost looks like at ten times the volume.

Tesla Model Y L’s new features flexed at unveiling event at Diner

Tesla CEO Elon Musk denies ridiculous Gigafactory Shanghai rumor
![Tesla Optimus Gen 3 [Credit: Tesla]](https://www.teslarati.com/wp-content/uploads/2026/03/tesla-optimus-gen3-diner-80x80.jpg)


