Apps
Coder creates the ultimate Tesla Model S and solar data visualization tool

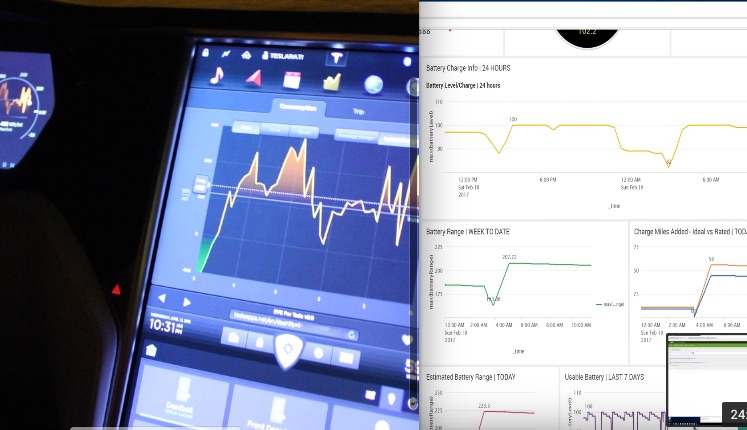
It is no secret that Tesla fans are, by and large, geeks. That theme manifests itself in the form of 3D printed mini Superchargers modded to serve as a USB phone charger, changing the color of the vehicle displayed on the center touchscreen, and most recently a Splunk-powered dashboard that overlays data from a Tesla Model S with energy data collected from a home solar system.
Splunk’s self-proclaimed objective is “We Make Machine Data Accessible, Usable and Valuable to Everyone”, taking massive amounts of data, or just data that is difficult to translate, into intelligible, insightful summaries, graphs and charts.
The dashboard serves mainly as a more practical display of the data from the car, with a focus on energy consumed and money saved from not driving an internal combustion engine vehicle. It’s clear that the Splunk platform is very flexible and with some very basic tweaks, can be modified to pull, calculate and display almost any data your little geek heart could desire.
The dashboards shown make use of simple calculations, fun graphs, neat displays with Red-Yellow-Green ranges added, and all within a very customizable layout.
For most Tesla users, an implementation like this could be helpful in the form of a smartphone app that would display useful information at the touch of a button. As a Tesla owner, it is a common occurrence for this exact type of detail to come up in conversation so having the cost per mile of driving, for example, available all the time would be helpful.
For more information on this project, checkout DeRage’s video below or head over to the Splunk homepage to start exploring what’s possible.
Apps
Tesla plans to put Insurance, FSD subscription directly into smartphone app

Tesla is planning to put its Insurance program and upcoming Full Self-Driving subscription directly into its Smartphone app, according to a software engineer who recently reverse-engineered parts of the automaker’s application.
Reddit u/Callump01 dug into the Tesla Smartphone App that owners use to do anything from control the vehicle’s climate to performing Smart Summon.
After reverse-engineering the app, Callump01 found several new things, including Tesla Insurance’s planned integration, a Safety Ratings feature, and a Simulator that will allow owners to see how driving changes will affect their rates.
Tesla Insurance Integration: Safety Ratings and Simulator
Tesla will have its Insurance program directly integrated into the application, according to Callump01. It will be located in its own defined section, and will be more readily available to owners, and could save time by helping avoid time-consuming phone calls. Many insurance companies, like GEICO, have apps where everything from filing a claim to getting insurance for a new car can be done from the touch of your fingertips.
There will also be a new “Safety Ratings” section. This will track your vehicle and is directly linked to your insurance if you use Tesla’s in-house program.
u/Callump01 said (via r/TeslaMotors):
“It will show the number of hours you’ve driven, how often you use AutoPilot, ABS events, forward collision warnings, autosteer strikeouts, accelerator variance, and many other metrics on both a per-trip and monthly basis, which you’ll be able to see in a neat graphical interface. You are given a ‘pass’ or ‘fail’ rating (though it is unclear whether that rating will be visible to the end user) and, from what I can tell, appears to be exclusive to HW2 and above and software version 2021.4.12 is required.”
Additionally, a “Simulator” section will allow owners to adjust factors related to categories that will affect rates. These include, but are not limited to ABS Activation, Hours Driven, Forced Autopilot Disengagements, Forward Collision Warnings, Unsafe Following Time, and Intensity of Acceleration and Braking.
u/Callump01 adds:
“Performance indicators are based on an average for that factor. The more factors you get into the green the more you’ll save on your premium. Your actual premium will not change more than 50% in a month based on your driving behavior.”
This feature is similar to Allstate’s Drivewise device, a simple plug-in that tracks your safe-driving habits and adjusts your monthly rates based on several factors like speed, braking, time of day, and mileage.
Full Self-Driving Subscription
It appears that Tesla will also allow owners to control the upcoming release of the FSD Subscription program that the automaker has talked about for some time.
Elon Musk has said on several occasions that Tesla’s FSD subscription will be available in Q2 2021. However, with only a few weeks left in the quarter, it is unclear whether Tesla will achieve this timeframe.
However, it is definitely in the works based on what was found in the App related to the subscription feature.
Firstly, there will be an option to be refunded if the program isn’t right for you or if there was an accidental purchase. Tesla will request information from the purchaser on why they would like a refund.
There are also mentions of a “Weekend Mode” and “Travel Mode” for the subscription, but there are no more details on what these features will provide to owners. Billing periods appear to be monthly, according to what was seen.
Details are relatively sparse as of now, especially considering the Subscription hasn’t formally been released by Tesla yet. However, it is exciting to know that Tesla plans to make its app more robust for owners, allowing more ease of access to certain features.
What do you think? Let us know in the comments below, or be sure to email me at joey@teslarati.com or on Twitter @KlenderJoey.
Apps
Tesla video conference call service shows developers are ready for a Tesla App Store

Over the years, vehicles have become another space for people to unwind and work. The pandemic has cemented the idea of in-car work spaces. Tesla’s cabins have become one of the most versatile spaces, partly thanks to its vehicles’ infotainment system.
Tesla Model S owner and CEO of Mass Luminosity Angel Munoz always believed his infotainment system could be put to better use.
For almost a year now, Munoz has been working on Beacon 4 Tesla, an in-car video conference service. Recently, Munoz invited Teslarati to join him and Beacon’s Senior VP of Technology Teodor Atroshenko for a video conference call inside his Tesla Model S.
“The process, the way it works is when you first set it up, you get into your Tesla, you launch the browser, you type in the BeaconX.com/Tesla. It shows you a QR code. You scan the QR code with your Beacon app and that logs you automatically into your car and then as soon as you join the call, the call basically appears on the screen there,” described Atroshenko.
How Beacon 4 Tesla Works
Munoz explained that Beacon 4 Tesla primarily worked through the driver’s phone at the moment.
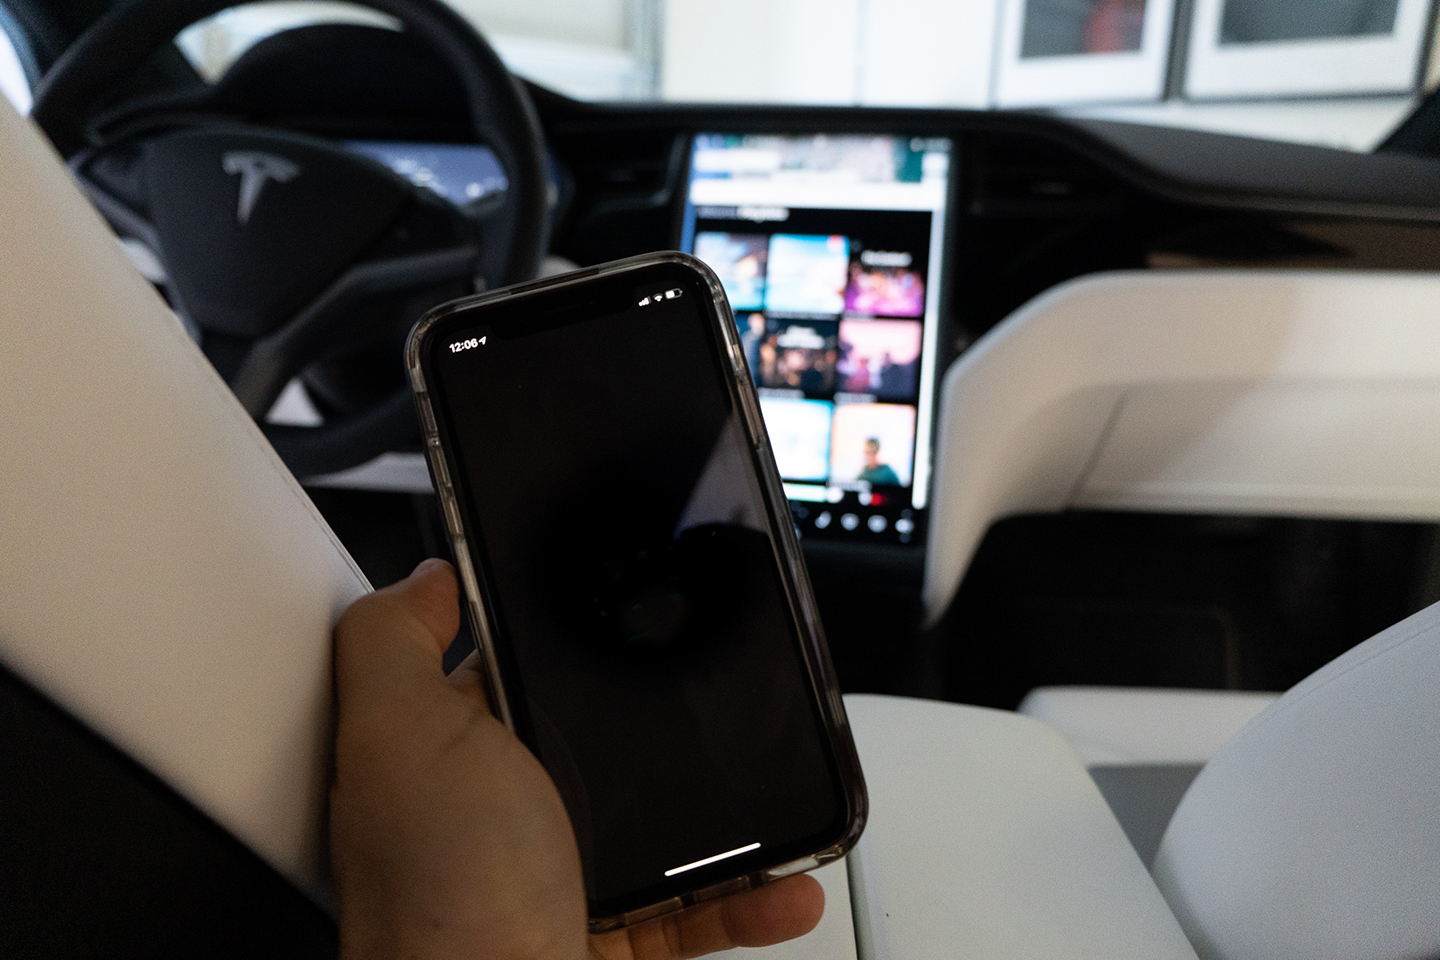
“The phone does three functionalities. Number one, it streams the sound that [the Tesla passenger is hearing] through the speakers of the car. Two, you’re using the microphone [of the phone via bluetooth]. And three, it’s streaming the video that it’s receiving to your Tesla,” Munoz explained.
“So primarily, it’s the phone. Think about it that way, it’s primarily the phone right now since we don’t have access to the onboard computers and all that,” he said.

The final candidate for Beacon and Beacon 4 Tesla will be available in June. The services will officially launch on July 7, 2021. However, Beacon’s services are currently available for free for conference calls with up to six people.
Tesla owners interested in trying out Beacon 4 Tesla can use the service as well. Follow the instructions below:
1. Install the Beacon mobile app on your iOS (https://apple.co/2PVwMWG) and/or Android (https://bit.ly/3mk52XT) device.
2. Create a new Beacon account or login to an existing one.
3. Tap on the menu icon (vertical ellipsis) on the top-right corner and select “Synchronize Contacts.” This creates a quick list of people to call. Read Beacon’s Privacy Policy at https://beaconx.com/privacy
4. Now launch the Tesla’s web browser and navigate to https://beaconx.com/tesla. The screen will now display a unique QR code.
5. On your Beacon mobile app, tap on the menu icon (vertical ellipsis) and select “Scan Beacon Code.” Point your mobile phone’s camera to the QR code. You will be prompted to confirm logging in to your Beacon account.
6. You are all set! While your Tesla is parked tap on the webcam icon next to any contact name on your Beacon app to initiate a video conference call in your Tesla.
For more information on Beacon® visit https://BeaconX.com
Tesla App Store for developers
Munoz and Atroshenko believe that Beacon 4 Tesla could offer a much better experience if the in-car video conferencing service had access to the in-cabin cameras currently active in the Tesla Model 3 and Model Y. The Model S Plaid and Model X Plaid will have cameras facing the cabin and a more powerful infotainment system. The Plaid Tesla vehicles also have surround sound speakers and noise cancellation features, technologies which can make in-car video conference calls very immersive.
“We would sign any kind of agreement with him [Elon Musk], if he just gives us access. And then it’d be a much better experience because it’s all tied in, there’d be an app on the Tesla instead of outside of the Tesla,” Munoz said.
Munoz and Atroshenko’s willingness to work with Tesla on Beacon’s in-car conferencing service hints that it may be time for the EV automaker to look into developing a dedicated Tesla App Store for third-party developers.
Munoz and Atroshenko did not set out to create Beacon 4 Tesla originally. They were simply enticed by the challenge of conducting video conference calls through Tesla’s infotainment system.

Atroshenko enumerated some of the challenges they faced while making Beacon 4 Tesla.
“We’re kind of making the best out of the situation—let’s put it that way. Because we can’t access the camera in Tesla. And the camera is not [an] HD camera. It has an overview of the interior, but basically it’s not up to par for video conferencing, at least not in this iteration. So hopefully the next cameras will be better, the ones facing the inside,” Atroshenko said.
After putting so much effort and work into the challenge, Munoz and Atroshenko want to share their work with all Tesla owners.
“Beacon 4 Tesla is free, so it comes with BeaconX. It’s our gift to Tesla and Elon Musk,” said Munoz. BeaconX is the conference call service the pair developed for laptops, phones and other devices.
Munoz and Atroshenko’s work hint that more app developers might be interested in building apps specifically for Tesla vehicles.
Tesla delivered almost 500,000 vehicles last year—despite the pandemic—and seems slated to deliver closer to 1 million cars in 2021. So far, Tesla has introduced a few in-car apps for drivers to use.
During the Q2 2020 earnings call, CEO Elon Musk and CFO Zachary Kirkhorn hinted that Tesla would launch a dedicated App Store once Full Self-Driving was ready and the company had a few million vehicles on the road. However, productive apps like Beacon 4 Tesla might be useful for Tesla passengers now.
Teslas used in ride-sharing fleets might benefit from an app store because apps could either entertain or make the ride more productive for passengers. Tesla apps might be useful for people who consider renting Tesla vehicles, too, especially for those on work trips or long family vacations traveling by car.
The Teslarati team would appreciate hearing from you. If you have any tips, email us at tips@teslarati.com or reach out to me at maria@teslarati.com.
Apps
Tesla’s new Powerwall update will coordinate vehicle charging during a power outage

Tesla has released a new software update for its Powerwall home battery system that will coordinate vehicle charging during a power outage.
The Tesla Powerwall will now take into account the energy needs of a home while charging the vehicle. If the home battery unit does not have enough energy to maintain the home’s essential needs and charge the vehicle, simultaneously, Powerwall will stop charging the Tesla vehicle.
In May 2019, Tesla CEO Elon Musk stated the feature would be “coming soon,” after Twitter follower and content creator DaErik asked if a better system could be enabled that would allow vehicles to not charge and use stored energy during outages. In February 2020, Tesla hinted at this update, citing Powerwalls ability to communicate more efficiently with charging vehicles. This would eliminate the possibility that vehicles would continue charging during an outage, thereby draining the Powerwall and leaving little energy left to power the home.
Tesla details the new Powerwall feature on its website:
“Powerwall now coordinates with Tesla vehicles during a power outage to charge your car without exceeding the energy and power capabilities of your Powerwall. The Powerwall reacts to the power needs of your home and will slow or stop your vehicle’s charging, keeping your home loads powered.
During a power outage, your Tesla vehicle will charge from the Powerwall whenever it is above the threshold set in the Tesla app. You can change this threshold to balance your home and transportation energy needs.
Keep your vehicle plugged in while the sun is shining, and surplus solar will charge your vehicle. Charging stops when Powerwall’s stored energy drops below your set threshold.”
Currently, the feature is available for the Model 3 and Model Y’s North American customers running software 2019.40.1 and newer. Owners must also have version 3.10.2 or later of the Tesla Mobile app, and software 1.46 or later on their Powerwall.
The behavior of the new system is outlined in a chart provided by Tesla as well, which shows Powerwall will make based on the state of its grid.

While the Powerwall is operating on a grid with any electric load, the vehicle will charge as usual. If there is a power outage in the area and Powerwall shows a surplus of energy that remains above the energy threshold, the system will then base the charging speed off of the home’s electric load if the load is low, the vehicle charges with surplus power and energy. If the load is high, the car will charge at a slower rate as the Powerwall will prioritize the needs of the home primarily.
Finally, if an outage is present and the Powerwall shows storage below the energy threshold, the car will automatically stop charging.
The advantages of this new system layout an easy system for owners who utilize both a Tesla vehicle and an energy storage system. Power outages are inconvenient for anyone, but luckily the new energy management system will allow owners not to charge their cars excessively while risking a possible disruption in power to their home.
-

 Elon Musk3 days ago
Tesla investors will be shocked by Jim Cramer’s latest assessment
-

 News1 week ago
Tesla Robotaxi’s biggest challenge seems to be this one thing
-

 News2 weeks ago
Texas lawmakers urge Tesla to delay Austin robotaxi launch to September
-

 Elon Musk2 weeks ago
First Look at Tesla’s Robotaxi App: features, design, and more
-

 Elon Musk2 weeks ago
xAI’s Grok 3 partners with Oracle Cloud for corporate AI innovation
-

 News2 weeks ago
SpaceX and Elon Musk share insights on Starship Ship 36’s RUD
-

 News2 weeks ago
Watch Tesla’s first driverless public Robotaxi rides in Texas
-

 News2 weeks ago
Tesla has started rolling out initial round of Robotaxi invites


